Rayovac 2012 Annual Report Download - page 5
Download and view the complete annual report
Please find page 5 of the 2012 Rayovac annual report below. You can navigate through the pages in the report by either clicking on the pages listed below, or by using the keyword search tool below to find specific information within the annual report.-
 1
1 -
 2
2 -
 3
3 -
 4
4 -
 5
5 -
 6
6 -
 7
7 -
 8
8 -
 9
9 -
 10
10 -
 11
11 -
 12
12 -
 13
13 -
 14
14 -
 15
15 -
 16
16 -
17
-
18
-
19
-
20
-
21
-
22
-
23
-
24
-
25
-
26
-
27
-
28
-
29
-
30
-
31
-
32
-
33
-
34
-
35
-
36
-
37
-
38
-
39
-
40
-
41
-
42
-
43
-
44
-
45
-
46
-
47
-
48
-
49
-
50
-
51
-
52
-
53
-
54
-
55
-
56
-
57
-
58
-
59
-
60
-
61
-
62
-
63
-
64
-
65
-
66
-
67
-
68
-
69
-
70
-
71
-
72
-
73
-
74
-
75
-
76
-
77
-
78
-
79
-
80
-
81
-
82
-
83
-
84
-
85
-
86
-
87
-
88
-
89
-
90
-
91
-
92
-
93
-
94
-
95
-
96
-
97
-
98
-
99
-
100
-
101
-
102
-
103
-
104
-
105
-
106
-
107
-
108
-
109
-
110
-
111
-
112
-
113
-
114
-
115
-
116
-
117
-
118
-
119
-
120
-
121
-
122
-
123
-
124
-
125
-
126
-
127
-
128
-
129
-
130
-
131
-
132
-
133
-
134
-
135
-
136
-
137
-
138
-
139
-
140
-
141
-
142
-
143
-
144
-
145
-
146
-
147
-
148
-
149
-
150
-
151
-
152
-
153
-
154
 |
 |

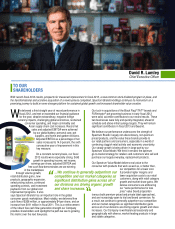
For fiscal 2013, we see a fourth consecutive record year with
steady, measured improvement, despite unfavorable foreign
currency impacts, continued cost increases, and a difficult global
economy and strained consumer budgets. Our net sales should
grow at or above the rate of GDP, consistent with our profile, with
adjusted EBITDA increasing at a slightly faster percentage rate
along with improvements in both GAAP and adjusted earnings
per share. We expect to generate at least $200 million of free
cash flow again in fiscal 2013.
We are investing in fiscal 2013 in
two higher-margin, faster-growing
areas – e-commerce, both our own
and our retailers’ platforms, and our
consumables business, specifically
our Remington® personal care division. This was evident with
our purchase in November 2012 of a majority stake in Shaser
Bioscience to create a leading position in the more than $50
billion global market for home use dermatology and hair
removal devices. More than two-thirds of our fiscal 2013 capital
spending represents investments in new production capacity,
technology infrastructure, new product development and cost
reduction projects.
Again in fiscal 2013, we expect to largely offset significant
commodity and Asian-sourced product cost increases with
continuous improvement programs, cost synergy programs,
retail distribution gains, the exit from unprofitable or low-margin
product lines, select pricing actions, and retention of stringent
cost control programs. Our target remains for each division
to achieve a three to five percent savings in its annual cost of
goods sold.
Spectrum Brands reached a milestone last year when our Board
of Directors approved the start of a regular quarterly common
stock dividend beginning in fiscal 2013 of $0.25 per share and
declared a one-time, special dividend of $1.00 per share paid
in mid-September of 2012. The
initiation of a dividend recognizes
our Company’s consistent and
ongoing ability to generate strong
free cash flow. It also reinforces
our commitment to deliver
attractive returns to shareholders. In future years after 2013, we
will evaluate the opportunity to increase our dividend based on
the growth of our free cash flow. The payment of the one-time,
special dividend testifies to our strong results in 2012 and
enabled shareholders to receive a dividend in 2012 equivalent to
our planned quarterly dividend in 2013.
As detailed earlier in this annual report, we completed the
accretive acquisition, and with attractive financing, of the
Hardware & Home Improvement Group (HHI) from Stanley
Black & Decker in December 2012 for $1.4 billion in cash. This
transformational acquisition of predominantly number-one North
American market share brands will enhance our Company’s