Public Storage 2013 Annual Report Download - page 5
Download and view the complete annual report
Please find page 5 of the 2013 Public Storage annual report below. You can navigate through the pages in the report by either clicking on the pages listed below, or by using the keyword search tool below to find specific information within the annual report.-
 1
1 -
 2
2 -
 3
3 -
 4
4 -
 5
5 -
 6
6 -
 7
7 -
 8
8 -
 9
9 -
 10
10 -
 11
11 -
 12
12 -
 13
13 -
 14
14 -
 15
15 -
 16
16 -
17
-
18
-
19
-
20
-
21
-
22
-
23
-
24
-
25
-
26
-
27
-
28
-
29
-
30
-
31
-
32
-
33
-
34
-
35
-
36
-
37
-
38
-
39
-
40
-
41
-
42
-
43
-
44
-
45
-
46
-
47
-
48
-
49
-
50
-
51
-
52
-
53
-
54
-
55
-
56
-
57
-
58
-
59
-
60
-
61
-
62
-
63
-
64
-
65
-
66
-
67
-
68
-
69
-
70
-
71
-
72
-
73
-
74
-
75
-
76
-
77
-
78
-
79
-
80
-
81
-
82
-
83
-
84
-
85
-
86
-
87
-
88
-
89
-
90
-
91
-
92
-
93
-
94
-
95
-
96
-
97
-
98
-
99
-
100
-
101
-
102
-
103
-
104
-
105
-
106
-
107
-
108
-
109
-
110
-
111
-
112
-
113
-
114
-
115
-
116
 |
 |

2
Operating expenses declined 1%. Lower marketing and repairs and maintenance costs were partially offset by substantially
higher property taxes. We have enjoyed three years of modest expense growth due to substantially reduced marketing, better
management of R&M and modest wage growth. We expect 2014 will return to a more normalized expense growth rate.
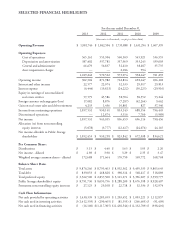
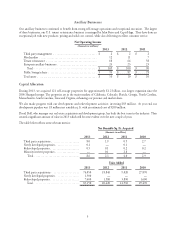
Net Operating Income
(Amounts in millions)
2013 2012 2011
Same Store $ 1,224 $ 1,131 $ 1,048
Acquired/redeveloped properties 102 70 51
Total $ 1,326 $ 1,201 $ 1,099
Total assets (before depreciation reserves) $ 12,176 $ 11,016 $ 10,722
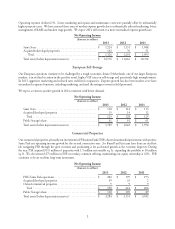
European Self-Storage
Our European operations continue to be challenged by a tough economic climate (Netherlands, one of our larger European
markets, is in its third recession in the past five years), higher VAT taxes on self-storage and persistently high unemployment.
In 2013, aggressive marketing and reduced rates stabilized occupancies. Expense growth has also been modest as we have
streamlined corporate functions, including marketing, and used the savings to invest in field personnel.
We expect a return to positive growth in 2014 consistent with better demand.
Net Operating Income
(Amounts in millions)
2013 2012 2011
Same Store $ 110 $ 114 $ 113
Acquired/developed properties 15 14 12
Total $ 125 $ 128 $ 125
Public Storage’s share $ 61 $ 61 $ 61
Total assets (before depreciation reserves) $ 1,709 $ 1,643 $ 1,596
Commercial Properties
Our commercial properties, primarily our investment in PS Business Parks (PSB), showed continued improvement, with positive
Same Park net operating income growth for the second consecutive year. Joe Russell and his team have done an excellent
job navigating PSB through the great recession and positioning it for accelerated growth as the economy improves. During
the year, PSB acquired $115 million of properties with 1.5 million net rentable sq. ft., expanding the portfolio to 30 million
sq. ft. We also invested $75 million in PSB’s secondary common offering, maintaining our equity ownership at 42%. PSB
continues to be an excellent long-term investment.
Net Operating Income
(Amounts in millions)
2013 2012 2011
PSB’s Same Park operations $ 202 $ 199 $ 193
Acquired/developed properties 39 33 2
Owned commercial properties 9 9 9
Total $ 250 $ 241 $ 204
Public Storage’s share $ 110 $ 105 $ 89
Total assets (before depreciation reserves) $ 3,284 $ 3,131 $ 3,032