Public Storage 2013 Annual Report Download - page 3
Download and view the complete annual report
Please find page 3 of the 2013 Public Storage annual report below. You can navigate through the pages in the report by either clicking on the pages listed below, or by using the keyword search tool below to find specific information within the annual report.-
 1
1 -
 2
2 -
 3
3 -
 4
4 -
 5
5 -
 6
6 -
 7
7 -
 8
8 -
 9
9 -
 10
10 -
 11
11 -
 12
12 -
 13
13 -
 14
14 -
15
-
16
-
17
-
18
-
19
-
20
-
21
-
22
-
23
-
24
-
25
-
26
-
27
-
28
-
29
-
30
-
31
-
32
-
33
-
34
-
35
-
36
-
37
-
38
-
39
-
40
-
41
-
42
-
43
-
44
-
45
-
46
-
47
-
48
-
49
-
50
-
51
-
52
-
53
-
54
-
55
-
56
-
57
-
58
-
59
-
60
-
61
-
62
-
63
-
64
-
65
-
66
-
67
-
68
-
69
-
70
-
71
-
72
-
73
-
74
-
75
-
76
-
77
-
78
-
79
-
80
-
81
-
82
-
83
-
84
-
85
-
86
-
87
-
88
-
89
-
90
-
91
-
92
-
93
-
94
-
95
-
96
-
97
-
98
-
99
-
100
-
101
-
102
-
103
-
104
-
105
-
106
-
107
-
108
-
109
-
110
-
111
-
112
-
113
-
114
-
115
-
116
 |
 |

1
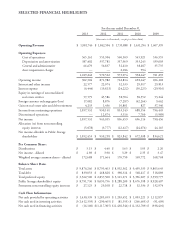
SELECTED FINANCIAL HIGHLIGHTS
Operating Revenue $ 1,981,746 $ 1,842,504 $ 1,735,888 $ 1,631,294 $ 1,607,395
Operating Expenses:
Cost of operations 565,161 555,904 560,509 545,921 536,555
Depreciation and amortization 387,402 357,781 357,969 353,245 339,003
General and administrative 66,679 56,837 52,410 38,487 35,735
Asset impairment charges — — 2,186 994 —
1,019,242 970,522 973,074 938,647 911,293
Operating income 962,504 871,982 762,814 692,647 696,102
Interest and other income 22,577 22,074 32,333 29,017 29,813
Interest expense (6,444) (19,813) (24,222) (30,225) (29,916)
Equity in earnings of unconsolidated
real estate entities 57,579 45,586 58,704 38,352 53,244
Foreign currency exchange gain (loss) 17,082 8,876 (7,287) (42,264) 9,662
Gain on real estate sales and debt retirement 4,233 1,456 10,801 827 37,540
Income from continuing operations 1,057,531 930,161 833,143 688,354 796,445
Discontinued operations — 12,874 3,316 7,760 (5,989)
Net income 1,057,531 943,035 836,459 696,114 790,456
Allocation (to) from noncontrolling
equity interests (5,078) (3,777) (12,617) (24,076) 44,165
Net income allocable to Public Storage
shareholders $ 1,052,453 $ 939,258 $ 823,842 $ 672,038 $ 834,621
Per Common Share:
Distributions $ 5.15 $ 4.40 $ 3.65 $ 3.05 $ 2.20
Net income - diluted $ 4.89 $ 3.90 $ 3.29 $ 2.35 $ 3.47
Weighted average common shares - diluted 172,688 171,664 170,750 169,772 168,768
Balance Sheet Data:
Total assets $ 9,876,266 $ 8,793,403 $ 8,932,562 $ 9,495,333 $ 9,805,645
Total debt $ 839,053 $ 468,828 $ 398,314 $ 568,417 $ 518,889
Total preferred equity $ 3,562,500 $ 2,837,500 $ 3,111,271 $ 3,396,027 $ 3,399,777
Public Storage shareholders’ equity $ 8,791,730 $ 8,093,756 $ 8,288,209 $ 8,676,598 $ 8,928,407
Permanent noncontrolling equity interests $ 27,125 $ 29,108 $ 22,718 $ 32,336 $ 132,974
Cash Flow Information:
Net cash provided by operating activities $ 1,430,339 $ 1,285,659 $ 1,203,452 $ 1,093,221 $ 1,112,857
Net cash used in investing activities $ (1,412,393) $ (290,465) $ (81,355) $ (266,605) $ (91,409)
Net cash used in financing activities $ (16,160) $ (1,117,305) $ (1,438,546) $ (1,132,709) $ (938,401)
For the year ended December 31,
2013 2012 2011 2010 2009
(Amounts in thousands, except per share data)