Public Storage 2012 Annual Report Download - page 9
Download and view the complete annual report
Please find page 9 of the 2012 Public Storage annual report below. You can navigate through the pages in the report by either clicking on the pages listed below, or by using the keyword search tool below to find specific information within the annual report.-
 1
1 -
 2
2 -
 3
3 -
 4
4 -
 5
5 -
 6
6 -
 7
7 -
 8
8 -
 9
9 -
 10
10 -
 11
11 -
 12
12 -
 13
13 -
 14
14 -
 15
15 -
 16
16 -
 17
17 -
 18
18 -
 19
19 -
 20
20 -
21
-
22
-
23
-
24
-
25
-
26
-
27
-
28
-
29
-
30
-
31
-
32
-
33
-
34
-
35
-
36
-
37
-
38
-
39
-
40
-
41
-
42
-
43
-
44
-
45
-
46
-
47
-
48
-
49
-
50
-
51
-
52
-
53
-
54
-
55
-
56
-
57
-
58
-
59
-
60
-
61
-
62
-
63
-
64
-
65
-
66
-
67
-
68
-
69
-
70
-
71
-
72
-
73
-
74
-
75
-
76
-
77
-
78
-
79
-
80
-
81
-
82
-
83
-
84
-
85
-
86
-
87
-
88
-
89
-
90
-
91
-
92
-
93
-
94
-
95
-
96
-
97
-
98
-
99
-
100
-
101
-
102
-
103
-
104
-
105
-
106
-
107
-
108
-
109
-
110
-
111
-
112
-
113
-
114
-
115
-
116
-
117
-
118
-
119
-
120
 |
 |
7
growth to its free cash flow (which is currently just over $100 million per year).
In the near term, it is focused on becoming very credit worthy.
Marc Oursin, Shurgard Europe’s Chief Executive Officer and his team are focused
on sales and service execution and preparing us for the eventual improvement
in the European economies.
Commercial Properties
Our investment in commercial properties consists of our wholly owned commercial
properties that are generally contiguous to our self-storage properties and our 41%
equity interest in PS Business Parks, Inc. (PSB). We own approximately two million
square feet directly and another 12 million square feet indirectly through our
investment in PSB.
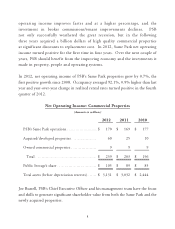
The commercial property business is more economically sensitive and capital
intensive than self-storage. By way of illustration, PSB’s Same Park net operating
income declined by 11% between 2008 and 2011, while Public Storage’s Same
Store net operating income only declined by 3.9% in one year, 2009. Tenant
improvements, broker commissions and maintenance capital expenditures range
from $1.50 per foot to $2.00 per foot, depending on economic conditions. In
contrast, Public Storage pays no broker commissions or tenant improvements and
our maintenance capital expenditures are about $0.55 per square foot or $70 million
per year. PSB invests nearly as much capital on a 30 million square foot portfolio
as Public Storage does on a 132 million square foot portfolio. Yet both companies’
net operating income is about $9 per foot.
We benefit two ways from PSB’s economic sensitivity. First, during economic
downturns, the purchase price of most commercial real estate declines
significantly. High quality properties can be acquired at significant discounts
to replacement cost. Second, as the economy improves, the operating leverage
of commercial real estate is far greater than self-storage, i.e., property net