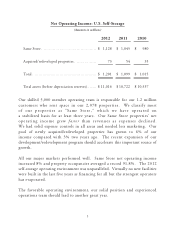
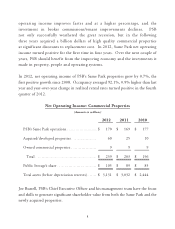
Public Storage 2012 Annual Report Download - page 5
Download and view the complete annual report
Please find page 5 of the 2012 Public Storage annual report below. You can navigate through the pages in the report by either clicking on the pages listed below, or by using the keyword search tool below to find specific information within the annual report.-
 1
1 -
 2
2 -
 3
3 -
 4
4 -
 5
5 -
 6
6 -
 7
7 -
 8
8 -
 9
9 -
 10
10 -
 11
11 -
 12
12 -
 13
13 -
 14
14 -
 15
15 -
 16
16 -
17
-
18
-
19
-
20
-
21
-
22
-
23
-
24
-
25
-
26
-
27
-
28
-
29
-
30
-
31
-
32
-
33
-
34
-
35
-
36
-
37
-
38
-
39
-
40
-
41
-
42
-
43
-
44
-
45
-
46
-
47
-
48
-
49
-
50
-
51
-
52
-
53
-
54
-
55
-
56
-
57
-
58
-
59
-
60
-
61
-
62
-
63
-
64
-
65
-
66
-
67
-
68
-
69
-
70
-
71
-
72
-
73
-
74
-
75
-
76
-
77
-
78
-
79
-
80
-
81
-
82
-
83
-
84
-
85
-
86
-
87
-
88
-
89
-
90
-
91
-
92
-
93
-
94
-
95
-
96
-
97
-
98
-
99
-
100
-
101
-
102
-
103
-
104
-
105
-
106
-
107
-
108
-
109
-
110
-
111
-
112
-
113
-
114
-
115
-
116
-
117
-
118
-
119
-
120
 |
 |

3
always generate more free cash per common share by funding acquisitions with
retained earnings or preferred share proceeds, instead of issuing common shares.
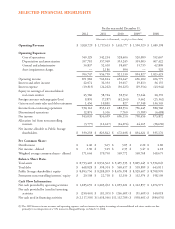
Over the past five, ten and 20 years, free cash flow1, dividends, earnings and funds
from operations1 per share have increased as follows:
2012 2007 2002 1992
Per common share:
Free cash flow $ 6.41 $ 4.30 $ 2.53 $ 1.14
Dividends $ 4.40 $ 2.00 $ 1.80 $ 0.84
Earnings $ 3.90 $ 1.17 $ 1.19 $ 0.90
Funds from operations $ 6.31 $ 4.97 $ 2.68 $ 1.27
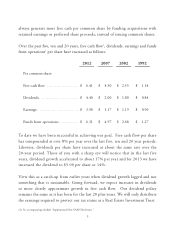
To date we have been successful in achieving our goal. Free cash flow per share
has compounded at over 8% per year over the last five, ten and 20 year periods.
Likewise, dividends per share have increased at about the same rate over the
20-year period. Those of you with a sharp eye will notice that in the last five
years, dividend growth accelerated to about 17% per year and for 2013 we have
increased the dividend to $5.00 per share or 14%.
View this as a catch-up from earlier years when dividend growth lagged and not
something that is sustainable. Going forward, we expect increases in dividends
to more closely approximate growth in free cash flow. Our dividend policy
remains the same as it has been for the last 20 plus years. We will only distribute
the earnings required to protect our tax status as a Real Estate Investment Trust.
(1) See accompanying schedule “Supplemental Non-GAAP Disclosures.”