Public Storage 2000 Annual Report Download - page 9
Download and view the complete annual report
Please find page 9 of the 2000 Public Storage annual report below. You can navigate through the pages in the report by either clicking on the pages listed below, or by using the keyword search tool below to find specific information within the annual report.-
 1
1 -
 2
2 -
 3
3 -
 4
4 -
 5
5 -
 6
6 -
 7
7 -
 8
8 -
 9
9 -
 10
10 -
 11
11 -
 12
12 -
 13
13 -
 14
14 -
 15
15 -
 16
16 -
 17
17 -
 18
18 -
 19
19 -
 20
20 -
21
-
22
-
23
-
24
-
25
-
26
-
27
-
28
-
29
-
30
-
31
-
32
-
33
-
34
-
35
-
36
-
37
-
38
-
39
-
40
-
41
-
42
-
43
-
44
-
45
-
46
-
47
-
48
-
49
-
50
-
51
-
52
 |
 |

7
P
UBLIC
S
TORAGE
, I
NC
. 2000 A
NNUAL
R
EPORT
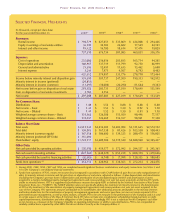
C
ONSOLIDATED
S
TATEMENTS OF
I
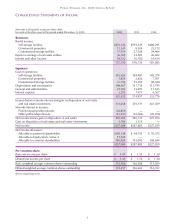
NCOME
(Amounts in thousands, except per share data)
For each of the three years in the period ended December 31, 2000 2000 1999 1998
Revenues:
Rental income:
Self-storage facilities
$653,524
$592,619 $488,291
Commercial properties
11,341
8,204 23,112
Containerized storage facilities
37,914
27,028 24,466
Equity in earnings of real estate entities
36,109
32,183 26,602
Interest and other income
18,422
16,700 18,614
757,310
676,734 581,085
Expenses:
Cost of operations:
Self-storage facilities
210,462
184,481 149,376
Commercial properties
3,826
2,826 7,951
Containerized storage facilities
37,798
29,509 48,508
Depreciation and amortization
148,967
137,719 111,799
General and administrative
21,306
12,491 11,635
Interest expense
3,293
7,971 4,507
425,652
374,997 333,776
Income before minority interest and gain on disposition of real estate
and real estate investments
331,658
301,737 247,309
Minority interest in income:
Preferred partnership interests
(24,859)
——
Other partnership interests
(13,497)
(16,006) (20,290)
Net income before gain on disposition of real estate
293,302
285,731 227,019
Gain on disposition of real estate and real estate investments
3,786
2,154 —
Net income
$297,088
$287,885 $227,019
Net income allocation:
Allocable to preferred shareholders
$100,138
$ 94,793 $ 78,375
Allocable to Equity Stock, Series A
11,042
——
Allocable to common shareholders
185,908
193,092 148,644
$297,088
$287,885 $227,019
Per common share:
Basic net income per share
$ 1.41
$ 1.53 $ 1.30
Diluted net income per share
$ 1.41
$ 1.52 $ 1.30
Basic weighted average common shares outstanding
131,566
126,308 113,929
Diluted weighted average common shares outstanding
131,657
126,669 114,357
See accompanying notes.