Public Storage 2000 Annual Report Download - page 6
Download and view the complete annual report
Please find page 6 of the 2000 Public Storage annual report below. You can navigate through the pages in the report by either clicking on the pages listed below, or by using the keyword search tool below to find specific information within the annual report.-
 1
1 -
 2
2 -
 3
3 -
 4
4 -
 5
5 -
 6
6 -
 7
7 -
 8
8 -
 9
9 -
 10
10 -
 11
11 -
 12
12 -
 13
13 -
 14
14 -
 15
15 -
 16
16 -
 17
17 -
18
-
19
-
20
-
21
-
22
-
23
-
24
-
25
-
26
-
27
-
28
-
29
-
30
-
31
-
32
-
33
-
34
-
35
-
36
-
37
-
38
-
39
-
40
-
41
-
42
-
43
-
44
-
45
-
46
-
47
-
48
-
49
-
50
-
51
-
52
 |
 |

4
P
UBLIC
S
TORAGE
, I
NC
. 2000 A
NNUAL
R
EPORT
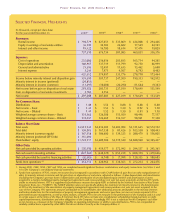
F
INANCIAL
R
EVIEW
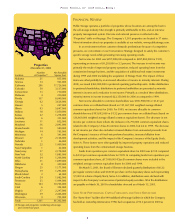
Properties
(December 31, 2000)
Number Net Rentable
Location of Properties
(1)
Square Feet
Alabama 21 835,000
Arizona 14 943,000
California 296 17,726,000
Colorado 50 3,137,000
Connecticut 13 710,000
Delaware 4 230,000
Florida 137 8,049,000
Georgia 62 3,626,000
Hawaii 5 247,000
Illinois 93 5,647,000
Indiana 18 1,050,000
Kansas 22 1,278,000
Kentucky 6 331,000
Louisiana 11 852,000
Maryland 36 2,043,000
Massachusetts 10 580,000
Michigan 14 765,000
Minnesota 6 341,000
Missouri 37 2,128,000
Nebraska 1 46,000
Nevada 22 1,409,000
New Hampshire 1 62,000
New Jersey 37 2,178,000
New York 32 1,885,000
North Carolina 24 1,266,000
Ohio 31 1,899,000
Oklahoma 8 429,000
Oregon 25 1,171,000
Pennsylvania 19 1,293,000
Rhode Island 2 64,000
South Carolina 24 1,082,000
Tennessee 25 1,494,000
Texas 164 10,766,000
Utah 6 324,000
Virginia 37 2,247,000
Washington 39 2,466,000
Wisconsin 9 703,000
Totals 1,361 81,302,000
(1) Storage and properties combining self-storage
and commercial space.
WA
39
OR
25
CA
296
NV
22
AZ
14
UT
6CO
50
NE
1
KS
22
OK
8
TX
164
MO
37
IL
93 IN
18
KY
6
OH
31
MN
6WI
9MI
14 PA
19
TN
25
AL
21
LA
11
GA
62
SC
24
FL
137
NC
24
VA
37
NY
32
MD
36
DE
4
NJ
37
CT
13
RI
2
MA
10
NH
1
HI
5
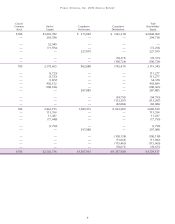
Public Storage operates a portfolio of properties whose locations are among the best in
the self-storage industry. Our strength is primarily attributable to this, and an intensive
property management system. Our size and national presence is reflected in the
“Properties” table on this page. The Company’s 1,361 properties are located in 37 states.
More information about our properties is available at our website, www.publicstorage.com.
In an environment where customer demands predominate because of competitive
pressures, we concentrate on our Convenience Strategy, designed to satisfy the customer’s
specific storage needs while generating increasing operating results.
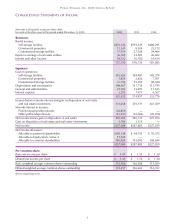
Net income for 2000 was $297,088,000 compared to $287,885,000 for 1999,
representing an increase of $9,203,000 or 3.2 percent. The increase in net income was
primarily the result of improved property operations, reduced operating losses from the
containerized storage business, and the acquisition of additional real estate investments
during 1999 and 2000 (including the acquisition of Storage Trust). The impact of these
items was offset partially by an increased allocation of income to minority interests. During
2000, we issued $365,000,000 in preferred operating partnership units. Unlike distributions
to preferred shareholders, distributions to preferred unitholders are presented as minority
interest in income and a reduction in net income. Primarily as a result of these distributions,
minority interest in income increased $22,350,000 for 2000 as compared to 1999.
Net income allocable to common shareholders was $185,908,000 or $1.41 per
common share on a diluted basis (based on 131,657,000 weighted average diluted
common equivalent shares) for 2000. For 1999, net income allocable to common
shareholders was $193,092,000 or $1.52 per common share on a diluted basis (based on
126,669,000 weighted average diluted common equivalent shares). The decrease in net
income per common share reflects the inclusion of 6,790,000 common equivalent shares
related to the Company’s Class B common shares in 2000, but not in 1999. The decrease
in net income per share also includes increased dilution from uninvested proceeds from
the Company’s issuance of fixed-rate preferred securities, increased dilution from
development activities, and the impact of the Company’s issuance of the Equity Stock,
Series A. These factors were offset partially by improved property operations and reduced
operating losses from the containerized storage business.
Funds from operations per common equivalent share for 2000 was $2.59 compared
to $2.50 per common equivalent share for 1999. In computing funds from operations per
common equivalent share, all 7,000,000 Class B common shares were included in the
weighted average common equivalent shares for 2000 and 1999.
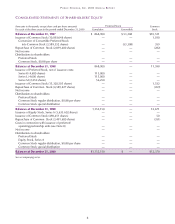
On March 5, 2001, the Board of Directors declared quarterly distributions of $0.22
per regular common share and $0.6125 per share on the depositary shares each representing
1/1,000 of a share of Equity Stock, Series A. In addition, distributions were declared with
respect to the Company’s various series of preferred equity securities. All of the distributions
are payable on March 30, 2001 to shareholders of record as of March 15, 2001.
S
AME
S
TORE
P
ERFORMANCE
, C
APITAL
F
ORMATION AND
S
TOCK
R
EPURCHASE
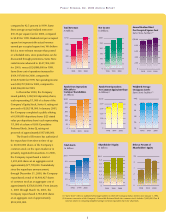
The “Same Store” facilities (the 949 stabilized self-storage facilities in which the Company
has held an ownership interest since 1994) had occupancies of 92.3 percent in 2000 as