Public Storage 1997 Annual Report Download - page 9
Download and view the complete annual report
Please find page 9 of the 1997 Public Storage annual report below. You can navigate through the pages in the report by either clicking on the pages listed below, or by using the keyword search tool below to find specific information within the annual report.-
 1
1 -
 2
2 -
 3
3 -
 4
4 -
 5
5 -
 6
6 -
 7
7 -
 8
8 -
 9
9 -
 10
10 -
 11
11 -
 12
12 -
 13
13 -
 14
14 -
 15
15 -
 16
16 -
 17
17 -
 18
18 -
 19
19 -
 20
20 -
21
-
22
-
23
-
24
-
25
-
26
-
27
-
28
-
29
-
30
-
31
-
32
-
33
-
34
-
35
-
36
-
37
-
38
-
39
-
40
-
41
-
42
-
43
-
44
-
45
-
46
-
47
-
48
 |
 |

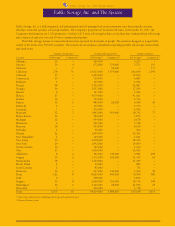
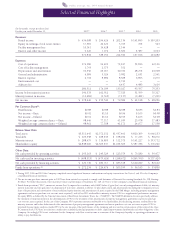
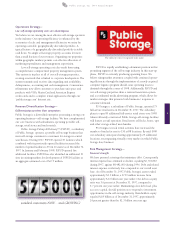
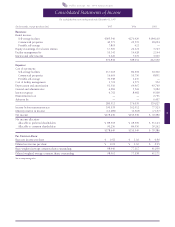
$8.76 per square foot for 1996.
Realized rent per square foot
represents the actual revenue
earned per occupied square foot.
This is believed to be a more
relevant measure than posted or
scheduled rates, since posted
rates can be discounted through
promotions. Same Store rental
income increased 6.6 percent
($475.2 million for 1997 versus
$445.6 million for 1996). Same
Store cost of operations increased
6.0 percent ($167.7 million for
1997 versus $158.2 million
for 1996).
Dividend
The Board of Directors declared
a $.22 per common share
quarterly dividend on March 2,
1998, along with quarterly
dividends on the Company’s
various series of preferred
stock. Distributions are payable
on March 31, 1998 to share-
holders of record as of the close
of business on March 16, 1998.
Dividends of $.88 per share
were paid on the common
stock in 1997.
The Company believes
that its practice of minimizing
distributions adds to share-
holder value. Retaining a sub-
stantial portion of funds from
operations (after funding distrib-
utions and capital improve-
ments) enables the Company to
acquire and develop properties,
invest in its other operations,
and reduce debt using internal
cash resources. This is one of the
ways the Company believes its
vision and strategies separate
it from its competitors. The
Company distributed 44 per-
cent of funds from operations
per common share for 1997 and
43 percent for 1996. Through its
relatively moderate payout ratio
in 1997 it retained $78.5 million
of capital ($110.2 million adding
back losses on PSPUD operations) to
purchase and develop properties
and invest in its other operations.
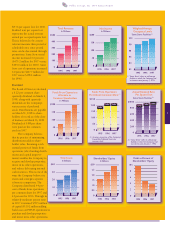
0
0.5
1.0
1.5
2.0
2.5
$3.0
1995 1996 1997
Shareholders’ Equity
In Billions
Public Storage, Inc. 1997 Annual Report
7
0
2.00
4.00
6.00
8.00
$10.00
1995 1996 1997
Annual Realized Rent
Per Square Foot
Same Store Facilities
(1)
(1) “Same Store” refers to self-storage
facilities in which the Company had
an interest since January 1, 1993.
$8.40 $8.76 $9.24
0
.50
1.00
1.50
2.00
$2.50
Funds From Operations
Per Diluted Common Share
(1)
1995 1996 1997
(1) Assumes conversion of the Company’s
Convertible Preferred Stock into
common stock.
$1.73
$1.98 $1.97
0
2
4
6
8
10%
1995 1996 1997
Debt as Percent of
Shareholders’ Equity
82
84
86
88
90
92%
1995 1996 1997
Weighted Average
Occupancy Levels
Same Store Facilities
(1)
(1) “Same Store” refers to self-storage
facilities in which the Company had
an interest since January 1, 1993.
7
0
50
100
150
$200
1995 1996 1997
Funds From Operations
Allocable to
Common Shareholders
In Millions
0
50
100
150
$200
1995 1996 1997
Net Income
In Millions
0
1.0
2.0
3.0
$4.0
1995 1996 1997
Total Assets
In Billions
0
100
200
300
400
$500
Total Revenues
In Millions
1995 1996 1997