Public Storage 1997 Annual Report Download - page 3
Download and view the complete annual report
Please find page 3 of the 1997 Public Storage annual report below. You can navigate through the pages in the report by either clicking on the pages listed below, or by using the keyword search tool below to find specific information within the annual report.-
 1
1 -
 2
2 -
 3
3 -
 4
4 -
 5
5 -
 6
6 -
 7
7 -
 8
8 -
 9
9 -
 10
10 -
 11
11 -
 12
12 -
 13
13 -
 14
14 -
15
-
16
-
17
-
18
-
19
-
20
-
21
-
22
-
23
-
24
-
25
-
26
-
27
-
28
-
29
-
30
-
31
-
32
-
33
-
34
-
35
-
36
-
37
-
38
-
39
-
40
-
41
-
42
-
43
-
44
-
45
-
46
-
47
-
48
 |
 |

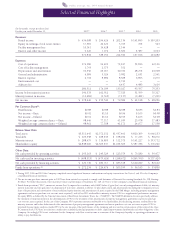
Public Storage, Inc. 1997 Annual Report
Selected Financial Highlights
1
(In thousands, except per share data)
For the year ended December 31, 1997
(1)
1996
(1)
1995
(1)
1994 1993
Revenues:
Rental income $ 434,008 $ 294,426 $ 202,134 $ 141,845 $ 109,203
Equity in earnings of real estate entities 17,569 22,121 3,763 764 563
Facility management fees 10,141 14,428 2,144
— —
Interest and other income 9,126 7,976 4,509 4,587 4,914
470,844 338,951 212,550 147,196 114,680
Expenses:
Cost of operations 174,186 94,491 72,247 52,816 42,116
Cost of facility management 1,793 2,575 352
— —
Depreciation and amortization 91,356 64,967 40,760 28,274 24,998
General and administrative 6,384 5,524 3,982 2,631 2,541
Interest expense 6,792 8,482 8,508 6,893 6,079
Environmental cost
— —
2,741
— —
Advisory fee
— —
6,437 4,983 3,619
280,511 176,039 135,027 95,597 79,353
Income before minority interest 190,333 162,912 77,523 51,599 35,327
Minority interest in income (11,684) (9,363) (7,137) (9,481) (7,291)
Net income $ 178,649 $ 153,549 $ 70,386 $ 42,118 $ 28,036
Per Common Share
(2)
:
Distributions $0.88 $0.88 $0.88 $0.85 $0.84
Net income – Basic $0.92 $1.10 $0.96 $1.05 $0.98
Net income – Diluted $0.91 $1.10 $0.95 $1.05 $0.98
Weighted average common shares
—
Basic 98,446 77,117 41,039 23,978 17,483
Weighted average common shares
—
Diluted 98,961 77,358 41,171 24,077 17,558
Balance Sheet Data:
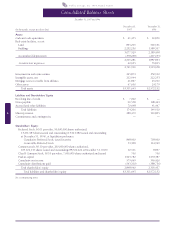
Total assets $3,311,645 $2,572,152 $1,937,461 $ 820,309 $ 666,133
Total debt $ 103,558 $ 108,443 $ 158,052 $ 77,235 $ 84,076
Minority interest $ 288,479 $ 116,805 $ 112,373 $ 141,227 $ 193,712
Shareholders’ equity $2,848,960 $2,305,437 $1,634,503 $ 587,786 $ 376,066
Other Data:
Net cash provided by operating activities $ 293,163 $ 245,329 $ 123,579 $ 79,180 $ 59,477
Net cash used in investing activities $ (408,313) $ (479,626) $ (248,672) $(169,590) $(137,429)
Net cash provided by financing activities $ 129,749 $ 180,717 $ 185,378 $ 100,029 $ 80,100
Funds from operations
(3)
$272,234 $ 224,476 $ 105,199 $ 56,143 $ 35,830
1. During 1997, 1996 and 1995 the Company completed several significant business combinations and equity transactions. See Notes 3 and 10 to the Company’s
consolidated financial statements.
2. The net income per share amounts prior to 1997 have been restated as required to comply with Statement of Financial Accounting Standards No. 128, Earnings
Per Share. For further discussion of net income per share and the impact of Statement No. 128, see Note 2 to the Company’s consolidated financial statements.
3. Funds from operations (“FFO”), means net income (loss) (computed in accordance with GAAP) before (i) gain (loss) on early extinguishment of debt, (ii) minority
interest in income and (iii) gain (loss) on disposition of real estate, adjusted as follows: (i) plus depreciation and amortization (including the Company’s pro-rata
share of depreciation and amortization of unconsolidated equity interests and amortization of assets acquired in the PSMI Merger, including property management
agreements and excess purchase cost over net assets acquired), and (ii) less FFO attributable to minority interest. FFO is a supplemental performance measure
for equity REITs as defined by the National Association of Real Estate Investment Trusts, Inc. (“NAREIT”). The NAREIT definition does not specifically address
the treatment of minority interest in the determination of FFO or the treatment of the amortization of property management agreements and excess purchase
cost over net assets acquired. In the case of the Company, FFO represents amounts attributable to its shareholders after deducting amounts attributable to the
minority interests and before deductions for the amortization of property management agreements and excess purchase cost over net assets acquired. FFO is
presented because many analysts consider FFO to be one measure of the performance of the Company and it is used in certain aspects of the terms of the Class
B Common Stock. FFO does not take into consideration scheduled principal payments on debt, capital improvements distributions and other obligations of the
Company. Accordingly, FFO is not a substitute for the Company’s cash flow or net income as a measure of the Company’s liquidity or operating performance or
ability to pay distributions.