Progressive 2005 Annual Report Download - page 10
Download and view the complete annual report
Please find page 10 of the 2005 Progressive annual report below. You can navigate through the pages in the report by either clicking on the pages listed below, or by using the keyword search tool below to find specific information within the annual report.-
 1
1 -
 2
2 -
 3
3 -
 4
4 -
 5
5 -
 6
6 -
 7
7 -
 8
8 -
 9
9 -
 10
10 -
 11
11 -
 12
12 -
 13
13 -
 14
14 -
 15
15 -
 16
16 -
 17
17 -
 18
18 -
 19
19 -
 20
20 -
 21
21 -
22
-
23
-
24
-
25
-
26
-
27
-
28
-
29
-
30
-
31
-
32
-
33
-
34
-
35
-
36
-
37
-
38
 |
 |

|
|
|
|
|
|
|
|
|
|
|
|
|
|
|
|
|
|
|
|
|
|
|
|
|
|
|
|
|
|
|
|
|
|
|
|
|
|
|
|
.10
90
95
100
105
110
115
1976
1980
1985
1990
1995
2000
(est.)
2005
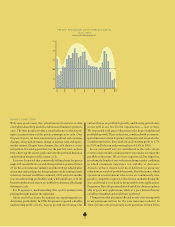
MARKET CONDITIONS
With some good reason, the cyclical nature of insurance is often
cited when describing market conditions and industry perform-
ance. The inset graph provides a visual reference to the surpris-
ingly consistent nature of the private passenger auto cycle. Over
the past
30
years, we have seen enormous political and economic
changes, along with dramatic swings in interest rates and equity-
market returns. Despite these changes, the cycle shows a consis-
tent pattern. It would appear that over the past few years, we have
been observing the ascent, peak and now the potential decline in
underwriting margins of the current cycle.
Last year I reported that consistently falling claims frequency
made 2003 and 2004 two of only three profitable years in the last
25 for the auto insurance industry and that 2004 produced what
was at that time perhaps the lowest industry-wide combined ratio
in history. As most would have assumed, 2005 was to be another
year of underwriting profitability and, while significant, even the
losses from the storm season are unlikely to dramatically change
the macro cycle.
For Progressive, understanding this cycle translates into
playing the right hand at the right time.
About one full cycle ago, the industry was reporting peak un-
derwriting profitability. In 1998, Progressive reported a healthy
underwriting profit of 8.4%, but our growth was slowing. Our
PRIVATE PASSENGER AUTO COMBINED RATIOS
1976–2005
Source: A.M. Best Company Inc.
culture thrives on profitable growth, and slowing growth does
not sit well at any level in the organization — now or then.
We responded with price reductions in the hope of additional
profitable growth. These reductions, combined with an unantic-
ipated increase in claim frequency and severity and a host of other
contributing factors, decreased our underwriting profit to 1.7%
in 1999 and led to an underwriting loss of 4.4% in 2000.
In our own small way we contributed to the cycle. As we
review today’s market conditions there are reasons to respect the
parallels to that time. We are more experienced, but imperfect,
in valuing the benefit of rate reductions during market conditions
in which consumers experience rate stability or decreases.
As such, we have chosen to be more deliberate in using rate
reductions in search of profitable growth. Drive Insurance, which
operates in an environment where rates are continuously com-
pared to competitive options, reduced rates modestly during the
year and found it very hard to get growth in new applications.
Progressive Direct kept rates relatively stable for the year and was
able to grow new applications, albeit at a pace far less than we
could have handled and would have preferred.
Change in market pricing is reflected in year-over-year growth
in net premiums written for the auto insurance industry. In
2004, the year-over-year growth in net premiums written fell to