Popeye's 2009 Annual Report Download - page 10
Download and view the complete annual report
Please find page 10 of the 2009 Popeye's annual report below. You can navigate through the pages in the report by either clicking on the pages listed below, or by using the keyword search tool below to find specific information within the annual report.-
 1
1 -
 2
2 -
 3
3 -
 4
4 -
 5
5 -
 6
6 -
 7
7 -
 8
8 -
 9
9 -
 10
10 -
 11
11 -
 12
12
 |
 |

8 AFC ENTERPRISES, INC.
Design: Eisenman Associates. Copywriting: Amy Binder. Photography: Grover Sterling, John Haigwood, Steve Swieter. Printing: Earth—Thebault, Bowne.
Cautionary Note Regarding Forward-Looking Statements
(1) Additional information concerning financial performance can be found in AFC’s Consolidated Financial Statements and Management’s Discussion & Analysis of Financial Condition and Results of Operations in the 2009
Annual Report on Form 10-K, including, without limitations, information in Item 6 of the Selected Financial Data related to total revenues.
(2) Weighted average common shares for the computation of diluted earnings per common share were 25.4 million, 25.7 million, and 28.8 million for 2009, 2008, and 2007, respectively.
Forward-Looking Statements: Certain statements in this Annual Report contain “forward-looking
statements” within the meaning of the federal securities laws. Statements regarding future events
and developments and our future performance, as well as management’s current expectations,
beliefs, plans, estimates, or projections relating to the future, are forward-looking statements
within the meaning of these laws. These forward-looking statements are subject to a number of
risks and uncertainties. Examples of such statements in this Annual Report include discussions
regarding the Company’s strategic plan, the Company’s plan to own and operate its current
company-operated restaurants, projections and expectations regarding same-store sales for fiscal
2010 and beyond, the Company’s ability to improve restaurant level margins, guidance for new
openings and restaurant closures, and the Company’s anticipated 2010 performances including
projections regarding general and administrative expenses, net earnings per diluted share, and
similar statements of belief or expectation regarding future events. Among the important factors
that could cause actual results to differ materially from those indicated by such forward-looking
statements are: competition from other restaurant concepts and food retailers; continuing
disruptions in the financial markets; the loss of franchisees and other business partners; labor
shortages or increased labor costs; increased costs of our principal food products; changes
in consumer preferences and demographic trends, as well as concerns about health or food
quality; instances of avian flu or other food-borne illnesses; general economic conditions; the
loss of senior management and the inability to attract and retain additional qualified management
personnel; limitations on our business under our 2005 Credit Facility, as amended and restated;
our ability to comply with the repayment requirements, covenants, tests, and restrictions contained
in the 2005 Credit Facility, as amended and restated; failure of our franchisees; a decline in the
number of franchised units; a decline in our ability to franchise new units; slowed expansion into
new markets; unexpected and adverse fluctuations in quarterly results; increased government
regulation; effects of volatile gasoline prices; supply and delivery shortages or interruptions;
currency, economic, and political factors that affect our international operations; inadequate
protection of our intellectual property and liabilities for environmental contamination; and the
other risk factors detailed in our 2009 Annual Report on Form 10-K and other documents we file
with the Securities and Exchange Commission. Therefore, you should not place undue reliance on
any forward-looking statements.
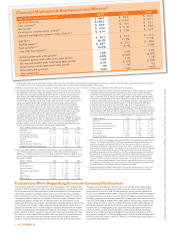
Financial Highlights & Key Operational Metrics(1)
(Dollars in millions, except per common share data) 2009 2008 2007
Franchise revenues $ 86.0 $ 84.6 $ 82.8
Total revenues
(1)
$ 148.0 $ 166.8 $ 167.3
Net income $ 18.8 $ 19.4 $ 23.1
Earnings per common share, diluted
(2)
$ 0.74 $ 0.76 $ 0.80
Adjusted earnings per common share, diluted
(3,6)
$ 0.74 $ 0.65 $ 0.74
EBITDA
(4,6)
$ 43.1 $ 46.6 $ 52.5
EBITDA margin
(4,6)
29.1% 27.9% 31.4%
Free cash flow
(5,6)
$ 23.7 $ 26.2 $ 28.5
Free cash flow margin
(5,6)
16.0% 15.7% 17.0%
Global system-wide sales growth
(7)
1.8% 0.6% 0.3%
Domestic system-wide same-store sales growth 0.6% (2.2)% (2.3)%
International system-wide same-store sales growth 1.9% 4.1% 1.1%
Global system-wide same-store sales growth 0.7% (1.7)% (2.0)%
New restaurant openings 95 140 124
Total restaurants 1,943 1,922 1,905
(Dollars in millions) 2009 2008 2007
Net income $ 18.8 $ 19.4 $ 23.1
Interest expense, net $ 8.4 $ 8.1 $ 8.7
Income tax expense $ 11.5 $ 12.8 $ 13.8
Depreciation and amortization $ 4.4 $ 6.3 $ 6.9
EBITDA $ 43.1 $ 46.6 $ 52.5
Total revenues $ 148.0 $ 166.8 $ 167.3
EBITDA margin 29.1% 27.9% 31.4%
(Dollars in millions, except per common share data) 2009 2008 2007
Net income $ 18.8 $ 19.4 $ 23.1
Other income, net $ (2.1) $ (4.6) $ (2.7)
Interest expense associated
with credit facility amendment $ 1.9 — —
Tax effect $ 0.1 $ 2.0 $ 1.0
Adjusted net income $ 18.7 $ 16.8 $ 21.4
Adjusted earnings per diluted share $ 0.74 $ 0.65 $ 0.74
Weighted-average diluted shares outstanding 25.4 25.7 28.8
(Dollars in millions) 2009 2008 2007
Net income $ 18.8 $ 19.4 $ 23.1
Depreciation and amortization $ 4.4 $ 6.3 $ 6.9
Stock-based compensation expense $ 1.9 $ 2.5 $ 1.7
Maintenance capital expenses $ (1.4) $ (2.0) $ (3.2)
Free cash flow $ 23.7 $ 26.2 $ 28.5
Total revenues $ 148.0 $ 166.8 $ 167.3
Free cash flow margin 16.0% 15.7% 17.0%
(6) EBITDA, free cash flow, and adjusted earnings per diluted share are supplemental non-GAAP financial
measures. The Company uses EBITDA, free cash flow, and adjusted earnings per diluted share, in
addition to net income, operating profit, and cash flows from operating activities, to assess its
performance and believes it is important for investors to be able to evaluate the Company using the
same measures used by management. The Company believes these measures are important indicators
of its operational strength and performance of its business because they provide a link between
profitability and operating cash flow. EBITDA, free cash flow, and adjusted earnings per diluted share
as calculated by the Company are not necessarily comparable to similarly titled measures reported
by other companies. In addition, EBITDA, free cash flow, and adjusted earnings per diluted share:
(a) do not represent net income, cash flows from operations, or earnings per share as defined by
GAAP; (b) are not necessarily indicative of cash available to fund cash flow needs; and (c) should not
be considered as an alternative to net income, earnings per share, operating profit, cash flows from
operating activities, or other financial information determined under GAAP.
(7) System-wide sales growth calculates combined sales of all restaurants that we operate or franchise. Sales
information for franchised restaurants is provided by our franchisees. System-wide sales are unaudited.
(4) The Company defines EBITDA as “earnings before interest expense, taxes, and depreciation and amortiza-
tion.” The following table reconciles on a historical basis for 2009, 2008, and 2007, the Company’s
EBITDA on a consolidated basis to the line on its consolidated statement of operations entitled net income,
which the Company believes is the most directly comparable GAAP measure on its consolidated statement
of operations to EBITDA:
(5) The Company defines free cash flow as net income plus depreciation and amortization, plus stock-based
compensation expense, minus maintenance capital expenses (which includes: for 2009 $0.3 million
for information technology hardware and software, and $1.1 million in other capital assets to maintain,
replace, and extend the lives of company-operated QSR equipment and facilities; for 2008 $0.4 million
for information technology hardware and software including new restaurant site modeling software, and
$1.6 million in other capital assets to repair and rebuild damaged restaurants, and to maintain, replace,
and extend the lives of company-operated QSR equipment and facilities; and for 2007 $0.6 million
for information technology hardware and software, $0.3 million in our re-imaging program, and
$2.3 million in other capital assets to repair and rebuild damaged restaurants, and to maintain, replace,
and extend the lives of company-operated QSR equipment and facilities). The following table reconciles on
a historical basis for 2009, 2008, and 2007, the Company’s free cash flow on a consolidated basis to the
line on its consolidated statement of operations entitled net income, which the Company believes is the
most directly comparable GAAP measure on its consolidated statement of operations to free cash flow:
(3) The Company defines adjusted earnings for the periods presented as the Company’s reported net income
after adjusting for certain non-operating items consisting of (i) other income, net (which includes: for 2009
$3.3 million on the sale of assets partially offset by a $0.4 million loss on insurance recoveries related to
asset damages, a $0.2 million impairment related to restaurant closures, and $0.6 million in impairments
and disposals of fixed assets; for 2008 $12.9 million from recoveries from directors and officers insurance
claims, $0.9 million in gain on the sale of assets, and $0.5 million in insurance recoveries related to property
damages, partially offset by $9.5 million of impairments of fixed assets and goodwill impairment and
$0.2 million of other expenses; and for 2007 $0.9 million from recoveries from directors and officers
insurance claims, $0.3 million in gain on the sale of assets, $3.2 million in insurance recoveries related to
property damages, and $1.6 million in income from business interruption insurance recoveries, partially
offset by $1.9 million of impairments of fixed assets and goodwill impairment, $0.8 million of costs related
to restaurant closures, and $0.6 million of other expenses), (ii) interest expenses associated with the
amendment and restatement of the Company’s 2005 Credit Facility, and (iii) the tax effect of these
adjustments. Adjusted earnings per diluted share provides the per share effect of adjusted net income on a
diluted basis. The following table reconciles on a historical basis for 2009, 2008, and 2007, the Company’s
adjusted earnings per diluted share on a consolidated basis to the line on its consolidated statement of
operations entitled net income, which the Company believes is the most directly comparable GAAP measure
on its consolidated statement of operations to adjusted earnings per diluted share: