Polaris 2007 Annual Report Download - page 13
Download and view the complete annual report
Please find page 13 of the 2007 Polaris annual report below. You can navigate through the pages in the report by either clicking on the pages listed below, or by using the keyword search tool below to find specific information within the annual report.-
 1
1 -
2
-
 3
3 -
 4
4 -
 5
5 -
 6
6 -
 7
7 -
 8
8 -
 9
9 -
 10
10 -
 11
11 -
 12
12 -
 13
13 -
 14
14 -
 15
15 -
 16
16 -
 17
17 -
 18
18
 |
 |

2007 ANNUAL REPORT NINE
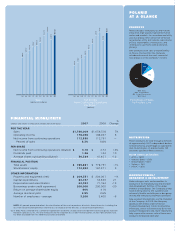
$211
$178
$189
05
$202
04
$179
03
$177
02
$151
01
$130
00
$120
99
$110
98 06 07
22.0%
21.7%
22.1%
05
23.5%
04
22.9%
03
22.1%
02
21.0%
01
21.2%
00
20.1%
99
18.8%
98 06 07
Gross Margin Percentage
from Continuing Operations
Cash Flow Provided
from Continuing Operations(1,2)
(dollars in millions, before changes in current
operating items and deferred taxes)
37%
41%
66%
05
38%
04
38%
03
41%
02
42%
01
46%
00
50%
99
47%
98 06 07
Return on Average Shareholder Equity
from Continuing Operations
$1.12
$1.24
$1.36
05
$0.92
04
$0.62
03
$0.56
02
$0.50
01
$0.44
00
$0.40
99
$0.36
98 06 07
$90
$53
$64
05
$89
04
$59
03
$52
02
$53
01
$62
00
$61
99
$57
98 06 07
Dividends per Share
(dollars)
In January 2008, Polaris announced a 12% increase
in the regular quarterly dividend, the 13th straight year
of increases, to $1.52 per share.
Purchase of Property and Equipment
for Continuing Operations
(dollars in millions)
$132
$308
$103
05
$67
04
$73
03
$76
02
$49
01
$40
00
$52
99
$38
98 06 07
2.4
6.9
1.9
05
1.4
04
2.5
03
2.4
02
2.2
01
2.4
00
3.0
99
2.2
98 06 07
Polaris Shares Repurchased
Since inception of the share repurchase program in 1996, approximately 31.1 million shares
have been repurchased at an average price of $31.88 per share.
(shares in millions) (dollars in millions)
NOTE: All periods presented reflect the classification of the marine products division’s financial results, including the loss from discontinued operations and the loss on
disposal of the division, as discontinued operations.
(1) In 1998, Polaris entered into a settlement agreement related to a trade secret infringement claim brought by Injection Research Specialists, Inc. The one-time provision for
litigation loss of $61.4 million pretax, or $0.77 per diluted share, has been excluded from the 1998 financial data presented.
(2) A reconciliation of the Company’s calculation of Cash Flow Provided to the most directly comparable cash flow measure, as required by Regulation G, appears on page 11
of this Annual Report.
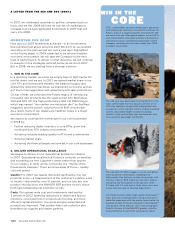
In 2007, we intended to get the business back on track, and we accomplished our goal.
Sales grew 7 percent, and net income from continuing operations per diluted share
increased 14 percent. Gross margins expanded, and all businesses increased market share.
Additionally, we launched two important products in 2007, the RANGER RZR and
Victory Vision, both with leading-edge technology and design in their respective classes.
THE
SCORECARD