Pepsi 2013 Annual Report Download - page 12
Download and view the complete annual report
Please find page 12 of the 2013 Pepsi annual report below. You can navigate through the pages in the report by either clicking on the pages listed below, or by using the keyword search tool below to find specific information within the annual report.-
 1
1 -
 2
2 -
 3
3 -
 4
4 -
 5
5 -
 6
6 -
 7
7 -
 8
8 -
 9
9 -
 10
10 -
 11
11 -
 12
12 -
 13
13 -
 14
14 -
 15
15 -
 16
16 -
 17
17 -
 18
18 -
 19
19 -
 20
20 -
 21
21 -
 22
22 -
23
-
24
-
25
-
26
-
27
-
28
-
29
-
30
-
31
-
32
-
33
-
34
-
35
-
36
-
37
-
38
-
39
-
40
-
41
-
42
-
43
-
44
-
45
-
46
-
47
-
48
-
49
-
50
-
51
-
52
-
53
-
54
-
55
-
56
-
57
-
58
-
59
-
60
-
61
-
62
-
63
-
64
-
65
-
66
-
67
-
68
-
69
-
70
-
71
-
72
-
73
-
74
-
75
-
76
-
77
-
78
-
79
-
80
-
81
-
82
-
83
-
84
-
85
-
86
-
87
-
88
-
89
-
90
-
91
-
92
-
93
-
94
-
95
-
96
-
97
-
98
-
99
-
100
-
101
-
102
-
103
-
104
-
105
-
106
-
107
-
108
-
109
-
110
-
111
-
112
-
113
-
114
-
115
-
116
-
117
-
118
-
119
-
120
-
121
-
122
-
123
-
124
-
125
-
126
-
127
-
128
-
129
-
130
-
131
-
132
-
133
-
134
-
135
-
136
-
137
-
138
-
139
-
140
-
141
-
142
-
143
-
144
-
145
-
146
-
147
-
148
-
149
-
150
-
151
-
152
-
153
-
154
-
155
-
156
-
157
-
158
-
159
-
160
-
161
-
162
-
163
-
164
 |
 |

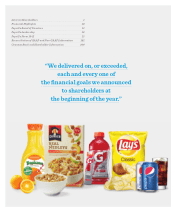
10
PEPSICO
Financial Highlights
PepsiCo, Inc. and Subsidiaries
(in millions except per share data; all per share amounts assume dilution)
(a) Percentage changes are based on unrounded amounts.
(b) Excludes the net mark-to-market impact of our commodity hedges, merger and integration charges and restructuring and impairment charges in both
years. In 2013, also excludes the Venezuela currency devaluation. In 2012, also excludes restructuring and other charges related to the transaction with Tingyi
and a pension lump-sum settlement charge. See page 143 “Reconciliation of GAAP and Non-GAAP Information” for a reconciliation to the most directly
comparable financial measure in accordance with GAAP.
(c) Excludes net mark-to-market impact of our commodity hedges, merger and integration charges, restructuring and impairment charges and tax benefits
in both years. In 2013, also excludes the Venezuela currency devaluation. In 2012, also excludes restructuring and other charges related to the transaction
with Tingyi and a pension lump-sum settlement charge. See page 53 “Results of Operations—Consolidated Review” in Management’s Discussion and
Analysis for a reconciliation to the most directly comparable financial measure in accordance with GAAP.
(d) Includes the impact of net capital spending, and excludes discretionary pension and retiree medical payments, merger and integration payments,
restructuring payments, net capital investments related to merger and integration, net capital investments related to restructuring plan and payments for
restructuring and other charges related to the transaction with Tingyi in both years. In 2013, also excludes net payments related to income tax settlements.
See page 65 “Our Liquidity and Capital Resources” in Management’s Discussion and Analysis for a reconciliation to the most directly comparable financial
measure in accordance with GAAP.
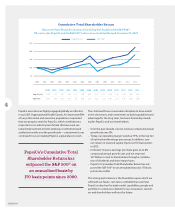
Summary of Operations 2013 2012 Chg (a)
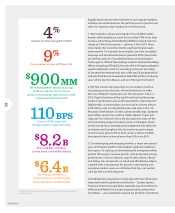
Net revenue $ 66,415 $ 65,492 1%
Core total operating pro t
(b) $ 10,061 $ 9,682 4%
Core earnings per share attributable to PepsiCo (c) $ 4.37 $ 4.10 7%
Free cash ow, excluding certain items (d) $ 8,162 $ 7,387 10%
Capital spending $ 2,795 $ 2,714 3%
Common share repurchases $ 3,001 $ 3,219 (7)%
Dividends paid $ 3,434 $ 3,305 4%
Mix of Net Revenue Net Revenues
Division Operating Profi t
Food 52%
Beverage 48%
U.S. 51%
Outside U.S. 49%
PepsiCo Americas Foods 37%
PepsiCo Americas Beverages 32%
PepsiCo Europe 21%
PepsiCo AMEA 10%
PepsiCo Americas Foods 52%
PepsiCo Americas Beverages 26%
PepsiCo Europe 12%
PepsiCo AMEA 10%