Pepsi 2013 Annual Report Download
Download and view the complete annual report
Please find the complete 2013 Pepsi annual report below. You can navigate through the pages in the report by either clicking on the pages listed below, or by using the keyword search tool below to find specific information within the annual report.-
 1
1 -
 2
2 -
 3
3 -
 4
4 -
 5
5 -
 6
6 -
 7
7 -
 8
8 -
 9
9 -
 10
10 -
 11
11 -
 12
12 -
13
-
14
-
15
-
16
-
17
-
18
-
19
-
20
-
21
-
22
-
23
-
24
-
25
-
26
-
27
-
28
-
29
-
30
-
31
-
32
-
33
-
34
-
35
-
36
-
37
-
38
-
39
-
40
-
41
-
42
-
43
-
44
-
45
-
46
-
47
-
48
-
49
-
50
-
51
-
52
-
53
-
54
-
55
-
56
-
57
-
58
-
59
-
60
-
61
-
62
-
63
-
64
-
65
-
66
-
67
-
68
-
69
-
70
-
71
-
72
-
73
-
74
-
75
-
76
-
77
-
78
-
79
-
80
-
81
-
82
-
83
-
84
-
85
-
86
-
87
-
88
-
89
-
90
-
91
-
92
-
93
-
94
-
95
-
96
-
97
-
98
-
99
-
100
-
101
-
102
-
103
-
104
-
105
-
106
-
107
-
108
-
109
-
110
-
111
-
112
-
113
-
114
-
115
-
116
-
117
-
118
-
119
-
120
-
121
-
122
-
123
-
124
-
125
-
126
-
127
-
128
-
129
-
130
-
131
-
132
-
133
-
134
-
135
-
136
-
137
-
138
-
139
-
140
-
141
-
142
-
143
-
144
-
145
-
146
-
147
-
148
-
149
-
150
-
151
-
152
-
153
-
154
-
155
-
156
-
157
-
158
-
159
-
160
-
161
-
162
-
163
-
164
 |
 |
2013 Annual Report
Table of contents
-
Page 1
2013 Annual Report -
Page 2
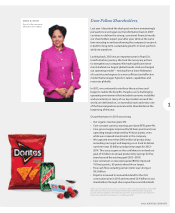
Letter to Shareholders Financial Highlights PepsiCo Board of Directors PepsiCo Leadership PepsiCo Form 10-K Reconciliation of GAAP and Non-GAAP Information Common Stock and Shareholder Information 1 10 11 12 13 141 144 "We delivered on, or exceeded, each and every one of the ï¬nancial goals we ... -
Page 3
... back in 2007: continue to deliver the strong, consistent financial results our shareholders expect year after year, while at the same time investing in and transforming the company to ensure it is built for long-term, sustainable growth. In short, perform while we transform. Looking back, 2012 was... -
Page 4
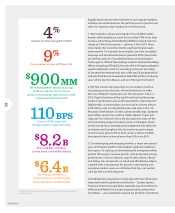
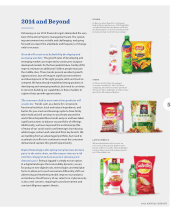
... center in Shanghai, China to fuel new product, packaging and equipment innovation for our businesses throughout Asia. Innovation as a percentage of net revenue grew to 9% in 2013, and as a whole our R&D investments have increased more than 25% since 2011. 3. Our developing and emerging markets... -
Page 5
... completely revamping PepsiCo University. "PepsiCo has knocked it out of the park with new product innovation this year. Across both snacks and beverages, they're consistently bringing great new products to the shelf." JOE DEPINTO President and Chief Executive Officer, 7-Eleven 2013 ANNUAL REPORT -
Page 6
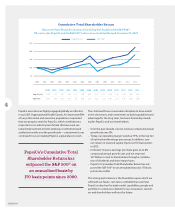
... invested capital improved 110 basis points in 2013. • In the last 10 years, earnings per share grew at an 8% compound annual growth rate, and we returned $57 billion in cash to shareholders through a combination of dividends and share repurchases. • PepsiCo's Cumulative Total Shareholder Return... -
Page 7
... for Lipton ready-to-drink teas and Lay's. CHINA In China in 2013, PepsiCo engaged consumers with Lay's "Do Us a Flavor" campaign, which drove volume growth for the brand. Other highlights include volume growth for Mirinda and Quaker. 5 LATIN AMERICA We launched Quaker Stila cereal, an extension... -
Page 8
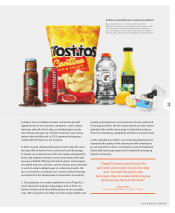
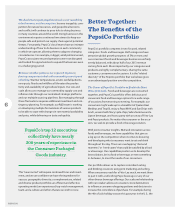
...have attractive global growth prospects of 5% or more, and our convenient foods and beverages businesses are fairly evenly balanced, with about half of our 2013 revenue coming from each. More importantly, our categories and products are highly complementary, sharing the same customers, consumers and... -
Page 9
... a strong competitive advantage in foodservice. The runaway success of Doritos Locos Tacos, a culinary innovation to drive growth for a PepsiCo foodservice customer, is just one example. Doritos Locos Tacos have exceeded $1 billion in retail sales since their launch in 2012. In 2013, PepsiCo won the... -
Page 10
..., and G&A. We also see significant financial benefits and savings from having corporate functions integrated globally, such as Global Procurement, R&D, Human Resources and Business Information Services. Looking beyond direct cost savings, these global platforms create capability advantages for us... -
Page 11
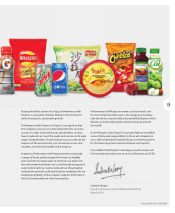
... returns over the long term. It is for these long-term investors that we run PepsiCo. I'm confident that PepsiCo's best days are yet to come, and I'm honored more than ever to serve as Chairman and CEO. Indra K. Nooyi PepsiCo Chairman and Chief Executive Officer March 2014 2013 ANNUAL REPORT -
Page 12
... the transaction with Tingyi in both years. In 2013, also excludes net payments related to income tax settlements. See page 65 "Our Liquidity and Capital Resources" in Management's Discussion and Analysis for a reconciliation to the most directly comparable financial measure in accordance with GAAP... -
Page 13
..., Smiths Group plc 67. Elected 2012. James J. Schiro Former Chief Executive Officer, Zurich Financial Services 68. Elected 2003. Indra K. Nooyi Chairman and Chief Executive Officer, PepsiCo 58. Elected 2001. Sharon Percy Rockefeller President and Chief Executive Officer, WETA Public Stations 69... -
Page 14
... Corporate Secretary Sanjeev Chadha Chief Executive Officer, PepsiCo Asia, Middle East and Africa Cynthia M. Trudell Executive Vice President, Human Resources and Chief Human Resources Officer, PepsiCo Albert P. Carey Chief Executive Officer, PepsiCo Americas Beverages Jim Wilkinson Executive Vice... -
Page 15
PepsiCo, Inc. Annual Report 2013 Form 10-K For the ï¬scal year ended December 28, 2013 13 -
Page 16
-
Page 17
...10-K (Mark One) ANNUAL REPORT PURSUANT TO SECTION 13 OR 15(d) OF THE SECURITIES EXCHANGE ACT OF 1934 For the fiscal year ended December 28, 2013 or TRANSITION REPORT PURSUANT TO SECTION 13 OR 15(d) OF THE SECURITIES EXCHANGE ACT OF 1934 For the transition period from Commission file number 1-1183 to... -
Page 18
... officers and directors of PepsiCo, Inc. are affiliates of PepsiCo, Inc.) as of June 14, 2013, the last day of business of our most recently completed second fiscal quarter, was $127,040,995,303 (based on the closing sale price of PepsiCo, Inc.'s Common Stock on that date as reported on the New York... -
Page 19
...Equity, Related Stockholder Matters and Issuer Purchases of Equity Securities Item 6. Selected Financial Data Item 7. Management's Discussion and Analysis of Financial Condition and Results of Operations Item 7A. Quantitative and Qualitative Disclosures About Market Risk Item 8. Financial Statements... -
Page 20
...revenue, growth in operating profit and EPS (as reported and excluding certain items and the impact of foreign exchange translation), market share, safety, product and service quality, organizational health, brand equity, employee diversity, net commodity inflation, productivity savings, net capital... -
Page 21
...'s net revenue was $2.6 billion in both 2013 and 2012 and $2.7 billion in 2011, and approximated 4% of our total net revenue in 2013, 2012 and 2011. Latin America Foods Either independently or in conjunction with third parties, LAF makes, markets, sells and distributes a number of snack food brands... -
Page 22
... our consolidated financial statements for additional information about our acquisition of Wimm-Bill-Dann Foods OJSC (WBD) in 2011. Asia, Middle East and Africa Either independently or in conjunction with third parties, AMEA makes, markets, sells and distributes a number of leading snack food brands... -
Page 23
... net revenue in 2013 and 2012 and 11% of our total net revenue in 2011. See Note 15 to our consolidated financial statements for additional information about our transaction with Tingyi in 2012. Our Distribution Network Our products are brought to market through direct-store-delivery (DSD), customer... -
Page 24
... Analysis of Financial Condition and Results of Operations" and Note 8 to our consolidated financial statements for more information on our customers, including our independent bottlers. Our Competition Our businesses operate in highly competitive markets. Our beverage, snack and food brands compete... -
Page 25
and brand and trademark development and protection. We believe that the strength of our brands, innovation and marketing, coupled with the quality of our products and flexibility of our distribution network, allows us to compete effectively. (1) The categories and category share information in the... -
Page 26
... and to restrict the use of benefit programs, such as the Supplemental Nutrition Assistance Program, to purchase certain beverages and foods. In addition, legislation has been enacted in certain U.S. states and in certain other countries in which our products are sold that requires collection and... -
Page 27
... relating to Iran by PepsiCo or its affiliates that occurred during our 2013 fiscal year. As previously disclosed, one of our foreign subsidiaries historically maintained a small office in Iran, which provided sales support to independent bottlers in Iran in connection with in-country sales... -
Page 28
... affect our business, financial condition, results of operations or stock price. Demand for our products may be adversely affected by changes in consumer preferences or any inability on our part to innovate or market our products effectively. We are a global food and beverage company operating in... -
Page 29
... and marketing programs; consumer perception of social media posts or other information disseminated by us or our employees, agents, customers, suppliers, bottlers, distributors, joint venture partners or other third parties; a downturn in economic conditions; taxes imposed on our products; or... -
Page 30
... our products are sold, demand for our products could decline, and we could be subject to lawsuits or new regulations that could affect sales of our products, any of which could have an adverse effect on our business, financial condition or results of operations. See also "Imposition of new taxes... -
Page 31
... many countries where we do business, including the United States, our primary beverage competitor is The Coca-Cola Company. We compete on the basis of brand recognition, taste, price, quality, product variety, distribution, marketing and promotional activity, packaging, convenience, service and the... -
Page 32
... the Latin America, Africa and Middle East regions, present important future growth opportunities for us. However, there can be no assurance that our existing products, variants of our existing products or new products that we make, manufacture, market or sell will be accepted or successful in any... -
Page 33
... fair value of pension or post-retirement assets that could increase future employee benefit costs and/or funding requirements of our pension or post-retirement plans. In addition, we cannot predict how current or worsening economic conditions will affect our critical customers, suppliers, bottlers... -
Page 34
...will position our business for future success and growth by allowing us to achieve a lower cost structure and operate more efficiently in the highly competitive food, snack and beverage industries. In order to capitalize on our cost reduction efforts, it will be necessary to make certain investments... -
Page 35
... of our products; our research and development efforts; our environmental impact, including use of agricultural materials, packaging, water, energy use and waste management; the practices of our employees, agents, customers, distributors, suppliers, bottlers, joint venture partners or other... -
Page 36
... executives and key employees; conforming standards, controls (including internal control over financial reporting, environmental compliance and health and safety compliance), procedures and policies, business cultures and compensation structures between us and the acquired company; consolidating... -
Page 37
... our ratings are under review for a potential downgrade. See also "Our Liquidity and Capital Resources" contained in "Item 7. Management's Discussion and Analysis of Financial Condition and Results of Operations." Our business could suffer if we are unable to protect our information systems against... -
Page 38
... in exchange rates may therefore adversely impact our business results or financial condition. See also "Market Risks" contained in "Item 7. Management's Discussion and Analysis of Financial Condition and Results of Operations" and Notes 1 and 10 to our consolidated financial statements. Climate... -
Page 39
... adverse effect on our consolidated financial statements, results of operations or cash flows. See also "Any damage to our reputation could have a material adverse effect on our business, financial condition and results of operations." Many factors may adversely affect the price of our common stock... -
Page 40
... processing plants and approximately 640 warehouses, distribution centers and offices. PepsiCo Americas Beverages PAB's most significant properties include its headquarters building in Somers, New York, an office building it shares with QFNA in downtown Chicago, Illinois and a shared service center... -
Page 41
...AMEA share two production facilities and a service center. Europe and AMEA share a research and development facility. PAB and LAF share four offices. PAB and AMEA share two concentrate plants. In addition to the company-owned or leased properties described above, we also utilize a highly distributed... -
Page 42
... as in sales, marketing, human resources and general management. Albert P. Carey, 62, has been Chief Executive Officer, PepsiCo Americas Beverages since September 2011. He served as President and Chief Executive Officer of Frito-Lay North America from June 2006 to September 2011. Mr. Carey began his... -
Page 43
...Incubator group, an innovation engine which created new businesses and developed them over several years. Earlier, Mr. Guimaraes worked in various marketing positions at Danone and Johnson & Johnson. Hugh F. Johnston, 52, was appointed Executive Vice President and Chief Financial Officer, PepsiCo in... -
Page 44
... 55, became PepsiCo's Executive Vice President, PepsiCo Chief Scientific Officer, Global Research & Development in May 2012. He previously held the position of Chief Executive Officer of PepsiCo's Global Nutrition Group since November 2010 and the position of PepsiCo's Chief Scientific Officer since... -
Page 45
..., Related Stockholder Matters and Issuer Purchases of Equity Securities. Stock Trading Symbol - PEP Stock Exchange Listings - The New York Stock Exchange is the principal market for our common stock, which is also listed on the Chicago and SIX Swiss Exchanges. Stock Prices - The composite quarterly... -
Page 46
A summary of our common stock repurchases (in millions, except average price per share) during the fourth quarter of 2013 under the $10 billion repurchase program authorized by our Board of Directors and publicly announced in the first quarter of 2013, which commenced on July 1, 2013 and expires on ... -
Page 47
... with our merger with The Quaker Oats Company in 2001, shares of our convertible preferred stock were authorized and issued to an employee stock ownership plan (ESOP) fund established by Quaker. The preferences, limitations and relative rights of the shares of convertible preferred stock are set... -
Page 48
... Pension and Retiree Medical Plans OUR FINANCIAL RESULTS Items Affecting Comparability Results of Operations - Consolidated Review Results of Operations - Division Review Frito-Lay North America Quaker Foods North America Latin America Foods PepsiCo Americas Beverages Europe Asia, Middle East and... -
Page 49
...- Basis of Presentation and Our Divisions Note 2 - Our Significant Accounting Policies Note 3 - Restructuring, Impairment and Integration Charges Note 4 - Property, Plant and Equipment and Intangible Assets Note 5 - Income Taxes Note 6 - Stock-Based Compensation Note 7 - Pension, Retiree Medical and... -
Page 50
...revenue, growth in operating profit and EPS (as reported and excluding certain items and the impact of foreign exchange translation), market share, safety, product and service quality, organizational health, brand equity, employee diversity, net commodity inflation, productivity savings, net capital... -
Page 51
... availability or less-favorable pricing for certain commodities that are necessary for our products. In addition to managing this volatility through the use of fixed-price contracts and purchase orders, pricing agreements and derivatives, we plan to leverage our research and development teams... -
Page 52
..., PAB, Europe, and AMEA. See Note 1 to our consolidated financial statements for financial information about our divisions and geographic areas. Frito-Lay North America Either independently or in conjunction with third parties, FLNA makes, markets, sells and distributes branded snack foods. These... -
Page 53
... to our consolidated financial statements for additional information about our acquisition of WBD in 2011. Asia, Middle East and Africa Either independently or in conjunction with third parties, AMEA makes, markets, sells and distributes a number of leading snack food brands including Lay's, Kurkure... -
Page 54
... branded products are sold to authorized bottlers, independent distributors and retailers. However, in certain markets, AMEA operates its own bottling plants and distribution facilities. AMEA also, either independently or in conjunction with third parties, makes, markets and sells ready-to-drink tea... -
Page 55
... of our employees serve on the boards of Pepsi Bottling Ventures LLC and other affiliated companies of PepsiCo and do not receive incremental compensation for such services. Our Business Risks We are subject to risks in the normal course of business. During 2012 and 2013, certain countries in Europe... -
Page 56
... which report to the Board regularly on matters relating to the risks the committees oversee. The Audit Committee of the Board of Directors reviews and assesses the guidelines and policies governing PepsiCo's risk management and oversight processes and assists the Board's oversight of financial... -
Page 57
...qualify for hedge accounting treatment, while others do not qualify and are marked to market through earnings. Cash flows from derivatives used to manage commodity price, foreign exchange or interest rate risks are classified as operating activities in the Consolidated Statement of Cash Flows. We do... -
Page 58
...interest rate changes relating to forecasted debt transactions. The notional amounts of the interest rate derivative instruments outstanding as of December 28, 2013 and December 29, 2012 were $7.9 billion and $8.1 billion, respectively. Assuming year-end 2013 investment levels and variable rate debt... -
Page 59
... periods presented, and have discussed these policies with our Audit Committee. Our critical accounting policies are revenue recognition; goodwill and other intangible assets; income tax expense and accruals; and pension and retiree medical plans. Revenue Recognition Our products are sold for cash... -
Page 60
...the aging of accounts receivable and our analysis of customer data. Bad debt expense is classified within selling, general and administrative expenses in our income statement. Goodwill and Other Intangible Assets We sell products under a number of brand names, many of which were developed by us. The... -
Page 61
... analysis of several estimates including future cash flows or income consistent with management's strategic business plans, annual sales growth rates and the selection of a discount rate based on market data available at the time. In the quantitative assessment of indefinite-lived intangible assets... -
Page 62
...of benefits earned by employees for working during the year (service cost), (2) the increase in the liability due to the passage of time (interest cost), and (3) other gains and losses as discussed below, reduced by (4) the expected return on assets for our funded plans. Significant assumptions used... -
Page 63
... Our investment policy also permits the use of derivative instruments which are primarily used to reduce risk. Our expected long-term rate of return on U.S. plan assets is 7.5% for 2014 and 7.8% for 2013. Our target investment allocations are as follows: Fixed income U.S. equity International equity... -
Page 64
...increase or decrease benefits for prior employee service (prior service cost/(credit)) is included in earnings on a straight-line basis over the average remaining service period of active plan participants. The health care trend rate used to determine our retiree medical plan's liability and expense... -
Page 65
... and expected asset returns and changes in tax or other benefit laws. For estimated future benefit payments, including our pay-as-you-go payments as well as those from trusts, see Note 7 to our consolidated financial statements. OUR FINANCIAL RESULTS Items Affecting Comparability The year-over-year... -
Page 66
...-tomarket systems in developed markets; expanding shared services; and implementing simplified organization structures to drive efficiency. The 2014 Productivity Plan is in addition to the productivity plan we began implementing in 2012 and is expected to continue the benefits of that plan. In 2013... -
Page 67
...businesses by leveraging new technologies and processes across PepsiCo's operations, go-to-market and information systems; heightening the focus on best practice sharing across the globe; consolidating manufacturing, warehouse and sales facilities; and implementing simplified organization structures... -
Page 68
... all open matters related to the audits for taxable years 2003 through 2009, which reduced our reserve for uncertain tax positions for the tax years 2003 through 2012. See Note 5 to our consolidated financial statements. In 2012, we recognized a non-cash tax benefit of $217 million ($0.14 per share... -
Page 69
... - Consolidated Review In the discussions of net revenue and operating profit below, "effective net pricing" reflects the year-overyear impact of discrete pricing actions, sales incentive activities and mix resulting from selling varying products in different package sizes and in different countries... -
Page 70
...points (see Note 15 to our consolidated financial statements). This gain was substantially offset during 2013 by incremental investments in our business, primarily in the AMEA and Europe segments and in corporate unallocated expenses. 2012 On a reported basis, total operating profit decreased 5% and... -
Page 71
...average debt balances and lower interest income due to lower investment interest rates, partially offset by higher gains on the market value of investments used to economically hedge a portion of our deferred compensation costs. The tax rate decreased 1.5 percentage points compared to the prior year... -
Page 72
... income attributable to PepsiCo per common share. Results of Operations - Division Review The results and discussions below are based on how our Chief Executive Officer monitors the performance of our divisions. Accordingly, 2013 and 2012 volume growth measures reflect an adjustment to the base year... -
Page 73
... Growth(a) 2012 Reported Growth % Impact of: Foreign exchange translation Acquisitions and divestitures 53rd week Organic Growth(a) (a) Amounts may not sum due to rounding. FLNA QFNA 4% (1)% - - 4% - - (0.5 )% LAF 7% 6 - 13 % PAB Europe AMEA (2)% 2% (2)% 1 - (1 )% 1 - 3.5 % 4 10 11 % Total... -
Page 74
...-single-digit growth in trademark Lay's and double-digit growth in our Sabra joint venture. These gains were partially offset by a double-digit decline in trademark SunChips. Operating profit grew 6%, primarily reflecting the net revenue growth and planned cost reductions across a number of expense... -
Page 75
... (11) (b) (12) - (12) 2013 Net revenue declined 1% and volume increased 3%. The net revenue decline primarily reflects unfavorable product mix. The volume growth primarily reflects growth in Müller Quaker Dairy (MQD) products (launched in the prior year) and low-single-digit growth in Oatmeal and... -
Page 76
...or additional tax liabilities could adversely affect our financial performance." in "Risk Factors" in Item 1A. 2012 Net revenue increased 9%, primarily reflecting effective net pricing and volume growth. Acquisitions and divestitures in Argentina and Brazil in the prior year contributed 2 percentage... -
Page 77
...-sweetened beverages. These taxes may adversely affect PAB's future financial performance. See also "Imposition of new taxes, disagreements with tax authorities or additional tax liabilities could adversely affect our financial performance." in "Risk Factors" in Item 1A. 2012 Net revenue decreased... -
Page 78
... offset by effective net pricing and planned cost reductions across a number of expense categories. Excluding the items affecting comparability in the above table (see "Items Affecting Comparability") operating profit declined 12%. The divestiture of our Mexico beverage business in 2011 contributed... -
Page 79
... revenue growth and planned cost reductions across a number of expense categories. Incremental investments in our business negatively impacted operating profit performance by 2 percentage points, which was substantially offset by the impact of lapping prior year impairment charges, which positively... -
Page 80
...-single-digit growth in Thailand and the Middle East, partially offset by a mid-single-digit decline in Australia. Additionally, India experienced mid-single-digit growth. Beverage volume grew 12%, driven by double-digit growth in China (including the co-branded juice products distributed through... -
Page 81
... Pakistan and high-single-digit growth in the Middle East as well as in China, which included the benefit of new co-branded juice products distributed through our joint venture with Tingyi. The Tingyi co-branded volume had a 4-percentage-point impact on AMEA's reported beverage volume. Excluding the... -
Page 82
...operating cash flow to our shareholders through dividend payments and share repurchases of $6.4 billion, partially offset by net proceeds from short-term borrowings of $1.2 billion, stock option proceeds of $1.1 billion and net proceeds from long-term debt of $0.3 billion. During 2012, net cash used... -
Page 83
... from long-term debt of $3.6 billion and stock option proceeds of $1.1 billion. We annually review our capital structure with our Board of Directors, including our dividend policy and share repurchase activity. In the first quarter of 2013, we approved a new share repurchase program providing... -
Page 84
... "Our Business Risks", Note 9 to our consolidated financial statements and "Our borrowing costs and access to capital and credit markets may be adversely affected by a downgrade or potential downgrade of our credit ratings." in "Risk Factors" in Item 1A. Credit Facilities and Long-Term Contractual... -
Page 85
... interests Net Income Attributable to PepsiCo Net Income Attributable to PepsiCo per Common Share Basic Diluted Weighted-average common shares outstanding Basic Diluted Cash dividends declared per common share See accompanying notes to consolidated financial statements. $ $ $ $ $ 67 -
Page 86
Consolidated Statement of Comprehensive Income PepsiCo, Inc. and Subsidiaries Fiscal years ended December 28, 2013, December 29, 2012 and December 31, 2011 (in millions) 2013 Pre-tax amounts Net income Other Comprehensive Income Currency translation adjustment Cash flow hedges: Reclassification of ... -
Page 87
...Statement of Cash Flows PepsiCo, Inc. and Subsidiaries Fiscal years ended December 28, 2013, December 29, 2012 and December 31, 2011 (in millions) 2013 Operating Activities Net income Depreciation and amortization Stock-based compensation expense Merger and integration costs Cash payments for merger... -
Page 88
Consolidated Statement of Cash Flows (continued) PepsiCo, Inc. and Subsidiaries Fiscal years ended December 28, 2013, December 29, 2012 and December 31, 2011 (in millions) 2013 Financing Activities Proceeds from issuances of long-term debt Payments of long-term debt Debt repurchase Short-term ... -
Page 89
... December 28, 2013 and December 29, 2012 (in millions except per share amounts) 2013 ASSETS Current Assets Cash and cash equivalents Short-term investments Accounts and notes receivable, net Inventories Prepaid expenses and other current assets Total Current Assets Property, Plant and Equipment, net... -
Page 90
... interests, net Currency translation adjustment Acquisitions and divestitures Other, net Balance, end of year Total Equity $ $ $ (a) Includes total tax benefits of $45 million in 2013, $84 million in 2012 and $43 million in 2011. See accompanying notes to consolidated financial statements. 72 -
Page 91
... net income in the first quarter of 2011 was approximately $9 million (or less than a penny per share). Raw materials, direct labor and plant overhead, as well as purchasing and receiving costs, costs directly related to production planning, inspection costs and raw material handling facilities, are... -
Page 92
... how our Chief Executive Officer assesses the performance of and allocates resources to our divisions. For additional unaudited information on our divisions, see "Our Operations" in Management's Discussion and Analysis of Financial Condition and Results of Operations. The accounting policies for the... -
Page 93
... financial statements for more information on our transaction with Tingyi and refranchising of our beverage business in Vietnam in our AMEA segment. Corporate Corporate unallocated includes costs of our corporate headquarters, centrally managed initiatives such as research and development... -
Page 94
...89 2,795 $ 2,714 $ 2011 439 43 413 1,006 588 693 3,182 157 3,339 FLNA QFNA LAF PAB Europe AMEA Total division Corporate (a) $ $ (a) Corporate assets consist principally of cash and cash equivalents, short-term investments, derivative instruments, property, plant and equipment and certain pension... -
Page 95
... damaged and out-of-date products. For additional unaudited information on our revenue recognition and related policies, including our policy on bad debts, see "Our Critical Accounting Policies" in Management's Discussion and Analysis of Financial Condition and Results of Operations. We are exposed... -
Page 96
... information on our sales incentives, see "Our Critical Accounting Policies" in Management's Discussion and Analysis of Financial Condition and Results of Operations. Advertising and other marketing activities, reported as selling, general and administrative expenses, totaled $3.9 billion in 2013... -
Page 97
... Financial Condition and Results of Operations. Income Taxes - Note 5, and for additional unaudited information see "Our Critical Accounting Policies" in Management's Discussion and Analysis of Financial Condition and Results of Operations. Stock-Based Compensation - Note 6. Pension, Retiree Medical... -
Page 98
...-to-market systems in developed markets; expanding shared services; and implementing simplified organization structures to drive efficiency. The 2014 Productivity Plan is in addition to the productivity plan we began implementing in 2012 and is expected to continue the benefits of that plan. In 2013... -
Page 99
...businesses by leveraging new technologies and processes across PepsiCo's operations, go-to-market and information systems; heightening the focus on best practice sharing across the globe; consolidating manufacturing, warehouse and sales facilities; and implementing simplified organization structures... -
Page 100
...01 per share) related to our acquisition of WBD, all of which were recorded in selling, general and administrative expenses in the Europe segment. Substantially all of the merger and integration accrual at December 28, 2013 is expected to be paid by the end of 2014. In 2012, we incurred merger and... -
Page 101
... 29, 2012 2013 merger and integration charges (a) Cash payments Non-cash charges Liability as of December 28, 2013 (a) Income amounts represent adjustments of previously recorded amounts. Note 4 - Property, Plant and Equipment and Intangible Assets A summary of our property, plant and equipment is... -
Page 102
... whether events or circumstances have occurred which indicate the need for revision. For additional unaudited information on our policies for amortizable brands, see "Our Critical Accounting Policies" in Management's Discussion and Analysis of Financial Condition and Results of Operations. 84 -
Page 103
... brands in Europe of $23 million and $14 million in 2012 and 2011, respectively. For additional unaudited information on our policies for nonamortizable intangible assets, see "Our Critical Accounting Policies" in Management's Discussion and Analysis of Financial Condition and Results of Operations... -
Page 104
...the U.S. Federal statutory tax rate to our annual tax rate is as follows: 2013 35.0% 1.2 (8.8) (2.4) (1.3) 23.7% 2012 35.0% 1.4 (6.9) (2.6) (1.7) 25.2% 2011 35.0% 1.3 (8.7) - (0.8) 26.8% U.S. Federal statutory tax rate State income tax, net of U.S. Federal tax benefit Lower taxes on foreign results... -
Page 105
...nondeductible goodwill Other Gross deferred tax liabilities Deferred tax assets Net carryforwards Stock-based compensation Retiree medical benefits Other employee-related benefits Pension benefits Deductible state tax and interest benefits Long-term debt obligations acquired Other Gross deferred tax... -
Page 106
... the first quarter of 2012. For additional unaudited information on our income tax policies, including our reserves for income taxes, see "Our Critical Accounting Policies" in Management's Discussion and Analysis of Financial Condition and Results of Operations. Reserves A number of years may elapse... -
Page 107
... PepsiCo equity performance units (PEPUnits) are granted to employees under the shareholder-approved 2007 Long-Term Incentive Plan (LTIP). Starting in 2012, certain executive officers were granted PEPUnits. These PEPUnits are earned based on achievement of a cumulative net income performance target... -
Page 108
...charges Total Income tax benefits recognized in earnings related to stock-based compensation Method of Accounting and Our Assumptions We account for our employee stock options under the fair value method of accounting using a Black-Scholes valuation model to measure stock option expense at the date... -
Page 109
... our stock-based compensation activity for the year ended December 28, 2013 is as follows: Our Stock Option Activity Outstanding at December 29, 2012 Granted Exercised Forfeited/expired Outstanding at December 28, 2013 Exercisable at December 28, 2013 Expected to vest as of December 28, 2013 Options... -
Page 110
...-line basis over the average remaining service period of active plan participants. In the fourth quarter of 2012, the Company offered certain former employees who had vested benefits in our defined benefit pension plans the option of receiving a one-time lump sum payment equal to the present value... -
Page 111
... retiree medical expenses and liabilities and were not material to our financial statements. Selected financial information for our pension and retiree medical plans are as follows: Pension U.S. 2013 Change in projected benefit liability Liability at beginning of year Service cost Interest cost Plan... -
Page 112
...Service cost Interest cost Expected return on plan assets Amortization of prior service cost/(credit) Amortization of net loss Settlement/curtailment (gain)/loss(a) Special termination benefits Total 2012 2011 International 2013 2012 2011 2013 2012 2011 51 88 (14) (28) 12 109 - 1 110 Retiree Medical... -
Page 113
...7.8% 2012 2011 2013 International 2012 2011 2013 2012 2011 Retiree Medical The following table provides selected information about plans with liability for service to date and total benefit liability in excess of plan assets: Pension U.S. 2013 Liability for service to date Fair value of plan assets... -
Page 114
... for retiree medical benefits. Plan Assets Pension Our pension plan investment strategy includes the use of actively managed securities and is reviewed periodically in conjunction with plan liabilities, an evaluation of market conditions, tolerance for risk and cash requirements for benefit payments... -
Page 115
... million to fund future U.S. retiree medical plan benefits. This contribution was invested consistent with the allocation of existing assets in the U.S. pension plan. Fair Value The guidance on fair value measurements defines fair value, establishes a framework for measuring fair value and expands... -
Page 116
Plan assets measured at fair value as of fiscal year-end 2013 and 2012 are categorized consistently by level in both years, and are as follows: 2013 Total U.S. plan assets* Equity securities: U.S. common stock(a) U.S. commingled funds(b) (c) International common stock(a) International commingled ... -
Page 117
... and retiree medical plans and related accounting policies and assumptions, see "Our Critical Accounting Policies" in Management's Discussion and Analysis of Financial Condition and Results of Operations. Note 8 - Related Party Transactions Our related party transactions in 2013, 2012 and 2011 are... -
Page 118
... equity method investments, our joint venture revenue is not included in our consolidated net revenue. Note 9 - Debt Obligations and Commitments The following table summarizes the Company's long-term debt obligations: 2013 Short-term debt obligations Current maturities of long-term debt Commercial... -
Page 119
... on an annual basis. Accrued liabilities for pension and retiree medical plans are not reflected in our long-term contractual commitments because they do not represent expected future cash outflows. See Note 7 for additional information regarding our pension and retiree medical obligations. 101 -
Page 120
... for hedge accounting treatment, while others do not qualify and are marked to market through earnings. Cash flows from derivatives used to manage commodity price, foreign exchange or interest rate risks are classified as operating activities in the Consolidated Statement of Cash Flows. We classify... -
Page 121
... terms of no more than two years. Exchange rate gains or losses related to foreign currency transactions are recognized as transaction gains or losses in our income statement as incurred. Our foreign currency derivatives had a total face value of $2.5 billion as of December 28, 2013 and $2.8 billion... -
Page 122
... of our cash and cash equivalents and short-term investments approximate fair value due to the short-term maturity. Short-term investments consist principally of short-term time deposits and index funds used to manage a portion of market risk arising from our deferred compensation liability. The 104 -
Page 123
...PepsiCo per common share is calculated using the weighted average of common shares outstanding adjusted to include the effect that would occur if in-the-money employee stock options were exercised and RSUs and preferred shares were converted into common shares. Options to purchase 0.6 million shares... -
Page 124
... stock accrues dividends at an annual rate of $5.46 per share. As of December 28, 2013 and December 29, 2012, there were 803,953 preferred shares issued and 167,053 and 186,553 shares outstanding, respectively. The outstanding preferred shares had a fair value of $69 million as of December 28, 2013... -
Page 125
...pension and retiree medical items: Net prior service credit (a) Net actuarial losses Tax amounts Net losses after tax Total net losses reclassified for the period, net of tax (a) Affected Line Item in the Consolidated Statement of Income $ 3 44 Interest expense Cost of sales Selling, general and... -
Page 126
... as follows: 2013 Other assets Noncurrent notes and accounts receivable Deferred marketplace spending Pension plans (a) Other investments Other $ Accounts payable and other current liabilities Accounts payable Accrued marketplace spending Accrued compensation and benefits Dividends payable Other... -
Page 127
...'s outstanding ordinary shares, pursuant to the purchase agreement dated December 1, 2010 between PepsiCo and certain selling shareholders of WBD for approximately $3.8 billion in cash (or $2.4 billion, net of cash and cash equivalents acquired). The acquisition of those shares increased our total... -
Page 128
... 2013, as part of the refranchising of our beverage business in Vietnam, we completed a transaction with Suntory Holdings Limited. Under the terms of the agreement, we sold a controlling interest in our Vietnam bottling operations. The new alliance serves as the franchise bottler for both companies... -
Page 129
... maintained strong governance policies and practices for many years. The management of PepsiCo is responsible for the objectivity and integrity of our consolidated financial statements. The Audit Committee of the Board of Directors has engaged independent registered public accounting firm, KPMG LLP... -
Page 130
... financial reporting. February 14, 2014 /s/ MARIE T. GALLAGHER Marie T. Gallagher Senior Vice President and Controller /s/ HUGH F. JOHNSTON Hugh F. Johnston Executive Vice President and Chief Financial Officer /s/ INDRA K. NOOYI Indra K. Nooyi Chairman of the Board of Directors and Chief Executive... -
Page 131
... December 28, 2013 and December 29, 2012, and the related Consolidated Statements of Income, Comprehensive Income, Cash Flows and Equity for each of the fiscal years in the three-year period ended December 28, 2013. We also have audited PepsiCo, Inc.'s internal control over financial reporting as of... -
Page 132
..., the consolidated financial statements referred to above present fairly, in all material respects, the financial position of PepsiCo, Inc. as of December 28, 2013 and December 29, 2012, and the results of its operations and its cash flows for each of the fiscal years in the three-year period ended... -
Page 133
... investments in our business. See Note 15 to our consolidated financial statements. (f) In the fourth quarter of 2013, we recognized a non-cash tax benefit of $209 million ($0.13 per share) associated with our agreement with the IRS resolving all open matters related to the audits for taxable years... -
Page 134
... In 2012, we recorded a pension lump sum settlement charge of $195 million ($131 million after-tax or $0.08 per share). See Note 7 to our consolidated financial statements. (i) Represents the composite high and low sales price and quarterly closing prices for one share of PepsiCo common stock. 116 -
Page 135
...PepsiCo $ Net income attributable to PepsiCo per common share - basic $ Net income attributable to PepsiCo per common $ share - diluted Cash dividends declared per common share $ Total assets Long-term debt Return on invested capital(a) $ $ 2012 65,492 6,178 3.96 3.92 2.1275 74,638 23,544 13.7 2011... -
Page 136
...-two weeks in our normal fiscal year. The 53rd week increased 2011 net revenue by $623 million and net income attributable to PepsiCo by $64 million or $0.04 per share. In 2011, we recorded $46 million ($28 million after-tax or $0.02 per share) of incremental costs related to fair value adjustments... -
Page 137
... bottlers: customers to whom we have granted exclusive contracts to sell and manufacture certain beverage products bearing our trademarks within a specific geographical area. Management operating cash flow: net cash provided by operating activities less capital spending plus sales of property, plant... -
Page 138
...: includes sales incentives and discounts offered through various programs to our customers, consumers or independent bottlers, as well as advertising and other marketing activities. Transaction gains and losses: the impact on our consolidated financial statements of exchange rate changes arising... -
Page 139
...submit under the Exchange Act is (1) recorded, processed, summarized and reported within the time periods specified in SEC rules and forms, and (2) accumulated and communicated to our management, including our Chief Executive Officer and Executive Vice President and Chief Financial Officer, to allow... -
Page 140
... for Issuance Under Equity Compensation Plans" in our 2014 Proxy Statement and is incorporated herein by reference. Information on the number of shares of PepsiCo Common Stock beneficially owned by each director and named executive officer, by all directors and executive officers as a group and on... -
Page 141
..."Corporate Governance at PepsiCo - Related Person Transactions" and "Corporate Governance at PepsiCo - Director Independence" in our 2014 Proxy Statement and is incorporated herein by reference. Item 14. Principal Accounting Fees and Services. Information on our Audit Committee's pre-approval policy... -
Page 142
... 7. Management's Discussion and Analysis of Financial Condition and Results of Operations": Consolidated Statement of Income - Fiscal years ended December 28, 2013, December 29, 2012 and December 31, 2011 Consolidated Statement of Comprehensive Income - Fiscal years ended December 28, 2013, December... -
Page 143
...(d) of the Securities Exchange Act of 1934, PepsiCo has duly caused this report to be signed on its behalf by the undersigned, thereunto duly authorized. Dated: February 14, 2014 PepsiCo, Inc. By: /s/ Indra K. Nooyi Indra K. Nooyi Chairman of the Board of Directors and Chief Executive Officer 125 -
Page 144
... Board of Directors and Chief Executive Officer Executive Vice President and Chief Financial Officer Senior Vice President and Controller (Principal Accounting Officer) Director Director Director Director Director Director Director Director Director Director Director Director DATE February 14, 2014... -
Page 145
... the rights of holders of long-term debt of PepsiCo, Inc. and all of its subsidiaries for which consolidated or unconsolidated financial statements are required to be filed with the Securities and Exchange Commission. Indenture dated May 21, 2007 between PepsiCo, Inc. and The Bank of New York Mellon... -
Page 146
...weeks ended June 12, 2010. Form of 2.500% Senior Note due 2016, which is incorporated herein by reference to Exhibit 4.2 to PepsiCo, Inc.'s Current Report on Form 8-K filed with the Securities and Exchange Commission on May 6, 2011. Board of Directors Resolutions Authorizing PepsiCo, Inc.'s Officers... -
Page 147
..., which is incorporated herein by reference to Exhibit 4.3 to PepsiCo, Inc.'s Current Report on Form 8-K filed with the Securities and Exchange Commission on February 28, 2013. Board of Directors Resolutions Authorizing PepsiCo, Inc.'s Officers to Establish the Terms of the Floating Rate Note due... -
Page 148
...to PepsiCo, Inc.'s Current Report on Form 8-K filed with the Securities and Exchange Commission on July 30, 2013. First Supplemental Indenture, dated as of February 26, 2010, among Pepsi-Cola Metropolitan Bottling Company, Inc., The Pepsi Bottling Group, Inc., Bottling Group, LLC and The Bank of New... -
Page 149
... 2035, which is incorporated herein by reference to Exhibit 4.17 to PepsiCo, Inc.'s Quarterly Report on Form 10-Q for the quarterly period ended March 20, 2010. Indenture, dated as of June 10, 2003 by and between Bottling Group, LLC, as obligor, and JPMorgan Chase Bank, as trustee, relating to $250... -
Page 150
... 8-K dated October 5, 2010. PepsiCo, Inc. 1994 Long-Term Incentive Plan, as amended and restated, effective October 1, 1999, which is incorporated herein by reference to Exhibit 10.6 to PepsiCo, Inc.'s Annual Report on Form 10-K for the fiscal year ended December 25, 1999.* PepsiCo Executive Income... -
Page 151
...PepsiCo, Inc. Executive Incentive Compensation Plan, which is incorporated herein by reference to Exhibit B to PepsiCo, Inc.'s Proxy Statement for its 2009 Annual Meeting of Shareholders filed with the Securities and Exchange Commission on March 24, 2009.* Form of Regular Performance-Based Long-Term... -
Page 152
... Quaker Long-Term Incentive Plan of 1990 and the PepsiCo, Inc. Director Stock Plan, effective as of November 17, 2006, which are incorporated herein by reference to Exhibit 10.31 to PepsiCo, Inc.'s Annual Report on Form 10-K for the fiscal year ended December 30, 2006.* Form of Non-Employee Director... -
Page 153
... Plan, the PepsiCo SharePower Stock Option Plan and the PepsiCo, Inc. 1987 Incentive Plan, effective as of February 2, 2007, which is incorporated herein by reference to Exhibit 10.41 to PepsiCo, Inc.'s Annual Report on Form 10-K for the fiscal year ended December 30, 2006.* Form of Pro Rata Long... -
Page 154
....1 to PepsiCo, Inc.'s Quarterly Report on Form 10-Q for the fiscal quarter ended June 13, 2009.* PBG 2004 Long Term Incentive Plan, which is incorporated herein by reference to Exhibit 99.1 to PepsiCo, Inc.'s Registration Statement on Form S-8 as filed with the Securities and Exchange Commission on... -
Page 155
...Long Term Incentive Plan, The Pepsi Bottling Group, Inc. 1999 Long Term Incentive Plan and PBG Stock Incentive Plan (effective February 8, 2007), which are incorporated herein by reference to Exhibit 99.7 to PepsiCo, Inc.'s Registration Statement on Form S-8 as filed with the Securities and Exchange... -
Page 156
... quarterly period ended September 3, 2011.* The PepsiCo International Retirement Plan Defined Benefit Program, as amended and restated effective as of January 1, 2010, which is incorporated herein by reference to Exhibit 10.68 to PepsiCo, Inc.'s Annual Report on Form 10-K for the fiscal year ended... -
Page 157
... 409A Program and Plan Document for the Pre-409A Program), effective as of December 1, 2012, which is incorporated herein by reference to Exhibit 10.75 to PepsiCo, Inc.'s Annual Report on Form 10-K for the fiscal year ended December 29, 2012.* Letter Agreement, dated March 9, 2012, between PepsiCo... -
Page 158
... Chief Financial Officer pursuant to Section 906 of the Sarbanes-Oxley Act of 2002. The following materials from PepsiCo, Inc.'s Annual Report on Form 10-K for the fiscal year ended December 28, 2013 formatted in XBRL (eXtensible Business Reporting Language): (i) the Consolidated Statement of Income... -
Page 159
... certain manufacturing facilities; re-engineering our go-to-market systems in developed markets; expanding shared services; and implementing simplified organization structures to drive efficiency. 2012 Multi-Year Productivity Plan In the year ended December 28, 2013, we incurred restructuring... -
Page 160
... free cash flow which we believe investors should consider in evaluating our free cash flow results. Return on Invested Capital (ROIC) Growth Reconciliation Reported ROIC Growth Impact of: Cash, Cash Equivalents and Short-Term Investments Commodity Mark-to-Market Net Impact Merger and Integration... -
Page 161
... $9,682 4% Cumulative Total Shareholder Return Return on PepsiCo stock investment (including dividends), the S&P 500® and the S&P Average of Industry Groups* in U.S. dollars Forward-Looking Statements This annual report contains statements reflecting our views about our future performance that... -
Page 162
... annual growth rate of 12%. Cash Dividends Declared Per Share (in $) 13 12 11 10 09 2.2400 2.1275 2.0250 1.8900 1.7750 Bloomberg for the years ending 2009-2013. Past performance is not necessarily indicative of future returns on investments in PepsiCo common stock. Year-end Market Price of Stock... -
Page 163
... bank, sale of shares, online account access, and electronic delivery of shareholder materials. Additional Information Investors and others should note that we currently announce material information to our investors using filings with the Securities and Exchange Commission, press releases, public... -
Page 164
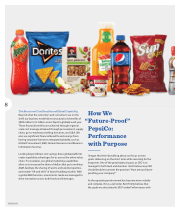
PepsiCo has 22 brands that each generated $1 billion or more in estimated annual retail sales in 2013. www.pepsico.com PepsiCo's 22 billion dollar brands globally include Walkers, Mirinda and 7UP outside the U.S. Lipton and Brisk are sold through a partnership with Unilever, and Starbucks is sold ...