Pep Boys 2009 Annual Report Download - page 86
Download and view the complete annual report
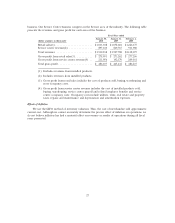
Please find page 86 of the 2009 Pep Boys annual report below. You can navigate through the pages in the report by either clicking on the pages listed below, or by using the keyword search tool below to find specific information within the annual report.-
 1
1 -
2
-
3
-
4
-
5
-
6
-
7
-
8
-
9
-
10
-
11
-
12
-
13
-
14
-
15
-
16
-
17
-
18
-
19
-
20
-
21
-
22
-
23
-
24
-
25
-
26
-
27
-
28
-
29
-
30
-
31
-
32
-
33
-
34
-
35
-
36
-
37
-
38
-
39
-
40
-
41
-
42
-
43
-
44
-
45
-
46
-
47
-
48
-
49
-
50
-
51
-
52
-
53
-
54
-
55
-
56
-
57
-
58
-
59
-
60
-
61
-
62
-
63
-
64
-
65
-
66
-
67
-
68
-
69
-
70
-
71
-
72
-
73
-
74
-
75
-
 76
76 -
 77
77 -
 78
78 -
 79
79 -
 80
80 -
 81
81 -
 82
82 -
 83
83 -
 84
84 -
 85
85 -
 86
86 -
 87
87 -
 88
88 -
 89
89 -
 90
90 -
 91
91 -
 92
92 -
 93
93 -
 94
94 -
 95
95 -
 96
96 -
97
-
98
-
99
-
100
-
101
-
102
-
103
-
104
-
105
-
106
-
107
-
108
-
109
-
110
-
111
-
112
-
113
-
114
-
115
-
116
-
117
-
118
-
119
-
120
-
121
-
122
-
123
-
124
-
125
-
126
-
127
-
128
-
129
-
130
-
131
-
132
-
133
-
134
-
135
-
136
-
137
-
138
-
139
-
140
-
141
-
142
-
143
-
144
-
145
-
146
-
147
-
148
-
149
-
150
-
151
-
152
-
153
-
154
-
155
-
156
-
157
-
158
-
159
-
160
-
161
-
162
-
163
-
164
 |
 |
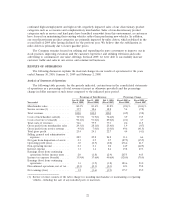
CAPITAL & LIQUIDITY
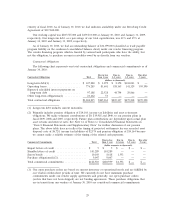
Capital Resources and Needs
Our cash requirements arise principally from the purchase of inventory, capital expenditures
related to existing and new stores, offices and distribution centers, debt service and contractual
obligations. Cash flows realized through the sales of automotive services, tires, parts and accessories are
our primary source of liquidity. Net cash provided by continuing operations was $87,223,000 for fiscal
2009 compared to a use of cash of $39,507,000 in fiscal 2008. The $126,730,000 improvement from the
prior year was due to a $72,749,000 increase in our net earnings (net of non-cash adjustments) and a
$53,663,000 favorable change in operating assets and liabilities. The change in operating assets and
liabilities was primarily due to favorable changes in inventory of $10,818,000, accounts payable of
$23,443,000 and in all other assets and liabilities of $19,402,000. The improved cash flows from
inventory resulted from more disciplined inventory management, including reduced seasonal inventory
purchases, inventory lead times and safety stocks. The improvement in accounts payable after taking
into consideration changes in the trade payable program liability (shown as cash flows from financing
activities on the Consolidated Statements of Cash Flows) improved by $7,936,000 primarily due to the
timing of our accounts payable cycle. The favorable change in all other assets and liabilities was due to
reduced accounts receivable as a result of improved collection of vendor allowances and trade
receivables. In addition, in the prior year, we expended approximately $5,000,000 to convert our
vacation plan to a paid time off plan, satisfied approximately $19,918,000 of liabilities associated with
the defined benefit portion of the executive supplemental retirement plan and paid $4,539,000 in
connection with reducing the notional value on our interest rate swap.
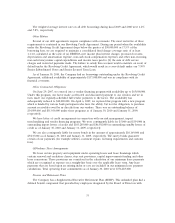
Cash used in investing activities was $29,871,000 for fiscal 2009 as compared to cash provided of
$78,726,000 in fiscal 2008. During fiscal 2009, we sold four properties that were classified as held for
sale for net proceeds of $3,602,000, of which $1,758,000 is included in discontinued operations. We also
completed sale leaseback transactions on four stores for net proceeds of $12,863,000. During fiscal
2009, we acquired substantially all of the assets (other than real property) of Florida Tire, Inc. for
$2,695,000. In connection with the acquisition, we recorded a contingent liability of $1,660,000 which
could result in future payments through November 2013. Fiscal 2008 included positive cash flows of
$211,470,000 primarily due to sale leaseback transactions. The proceeds were used primarily to
repurchase 29 properties for $117,121,000 that were previously leased under a master operating lease.
Capital expenditures were $43,214,000 and $34,762,000, for fiscal 2009 and fiscal 2008, respectively.
Capital expenditures for the current year were for improvement of our existing stores and distribution
centers, opening of new Service & Tire Centers and one prototype Supercenter.
Our fiscal 2010 capital expenditures are expected to be approximately $68,000,000 which includes
the addition of approximately 40 Service & Tire Centers and required expenditures for our existing
stores, offices and distribution centers. These expenditures are expected to be funded by cash on hand,
net cash generated from operating activities and opportunistic single store sale leaseback transactions.
Additional capacity, if needed, exists under our line of credit.
In fiscal 2009 and fiscal 2008, we used cash in financing activities of $39,358,000 and $38,813,000,
respectively. In fiscal 2009, we repurchased $16,970,000 of our outstanding 7.5% Senior Subordinated
Notes for $10,722,000 and repaid $23,862,000 of borrowings under our credit facility. In fiscal 2008, we
used the proceeds from the sale leaseback transactions discussed above to reduce debt obligations
under our then existing credit facility and to repurchase $25,465,000 principal amount of our 7.5%
Senior Secured Notes for $22,005,000.
We anticipate that cash on hand, cash generated by operating activities, and cash provided by
opportunistic single store sale leaseback transactions will exceed our expected cash requirements in
fiscal 2010. In addition, we expect to have excess availability under our existing line of credit during the
28