Pep Boys 2009 Annual Report Download - page 138
Download and view the complete annual report
Please find page 138 of the 2009 Pep Boys annual report below. You can navigate through the pages in the report by either clicking on the pages listed below, or by using the keyword search tool below to find specific information within the annual report.-
 1
1 -
2
-
3
-
4
-
5
-
6
-
7
-
8
-
9
-
10
-
11
-
12
-
13
-
14
-
15
-
16
-
17
-
18
-
19
-
20
-
21
-
22
-
23
-
24
-
25
-
26
-
27
-
28
-
29
-
30
-
31
-
32
-
33
-
34
-
35
-
36
-
37
-
38
-
39
-
40
-
41
-
42
-
43
-
44
-
45
-
46
-
47
-
48
-
49
-
50
-
51
-
52
-
53
-
54
-
55
-
56
-
57
-
58
-
59
-
60
-
61
-
62
-
63
-
64
-
65
-
66
-
67
-
68
-
69
-
70
-
71
-
72
-
73
-
74
-
75
-
76
-
77
-
78
-
79
-
80
-
81
-
82
-
83
-
84
-
85
-
86
-
87
-
88
-
89
-
90
-
91
-
92
-
93
-
94
-
95
-
96
-
97
-
98
-
99
-
100
-
101
-
102
-
103
-
104
-
105
-
106
-
107
-
108
-
109
-
110
-
111
-
112
-
113
-
114
-
115
-
116
-
117
-
118
-
119
-
120
-
121
-
122
-
123
-
124
-
125
-
126
-
127
-
 128
128 -
 129
129 -
 130
130 -
 131
131 -
 132
132 -
 133
133 -
 134
134 -
 135
135 -
 136
136 -
 137
137 -
 138
138 -
 139
139 -
 140
140 -
 141
141 -
 142
142 -
 143
143 -
 144
144 -
 145
145 -
 146
146 -
 147
147 -
 148
148 -
149
-
150
-
151
-
152
-
153
-
154
-
155
-
156
-
157
-
158
-
159
-
160
-
161
-
162
-
163
-
164
 |
 |

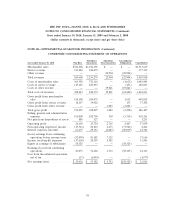
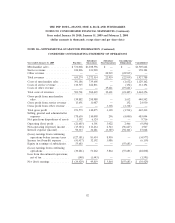
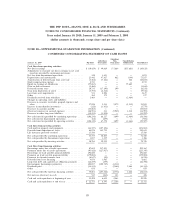
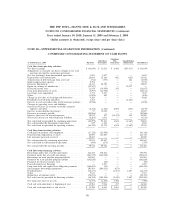
THE PEP BOYS—MANNY, MOE & JACK AND SUBSIDIARIES
NOTES TO CONSOLIDATED FINANCIAL STATEMENTS (Continued)
Years ended January 30, 2010, January 31, 2009 and February 2, 2008
(dollar amounts in thousands, except share and per share data)
NOTE 20—SUPPLEMENTAL GUARANTOR INFORMATION (Continued)
CONDENSED CONSOLIDATING BALANCE SHEET
Subsidiary Subsidiary Consolidation/
As of January 31, 2009 Pep Boys Guarantors Non-Guarantors Elimination Consolidated
ASSETS
Current assets:
Cash and cash equivalents ...... $ 12,753 $ 6,393 $ 2,186 $ — $ 21,332
Accounts receivable, net ........ 16,571 12,260 — — 28,831
Merchandise inventories ........ 199,304 365,627 — — 564,931
Prepaid expenses ............. 13,597 15,820 13,919 (17,946) 25,390
Other current assets .......... 1,193 11 66,797 (5,580) 62,421
Assets held for disposal ........ 1,830 10,823 — — 12,653
Total current assets ........... 245,248 410,934 82,902 (23,526) 715,558
Property and equipment—net .... 239,859 487,956 32,226 (19,710) 740,331
Investment in subsidiaries ...... 1,699,568 — — (1,699,568) —
Intercompany receivable ....... — 989,077 85,145 (1,074,222) —
Deferred income taxes ......... 24,075 53,633 — — 77,708
Other long-term assets ......... 17,614 1,178 — — 18,792
Total assets ................. $2,226,364 $1,942,778 $200,273 $(2,817,026) $1,552,389
LIABILITIES AND
STOCKHOLDERS’ EQUITY
Current liabilities:
Accounts payable ............. $ 212,331 $ 9 $ — $ — $ 212,340
Trade payable program liability . . . 31,930 — — — 31,930
Accrued expenses ............ 28,802 67,748 175,985 (17,781) 254,754
Deferred income taxes ......... 16,355 25,238 — (5,745) 35,848
Current maturities of long-term
debt and obligations under
capital leases .............. 1,208 245 — — 1,453
Total current liabilities ......... 290,626 93,240 175,985 (23,526) 536,325
Long-term debt and obligations
under capital leases less current
maturities ................ 332,682 19,700 — — 352,382
Other long-term liability ........ 34,868 35,454 — — 70,322
Deferred gain from asset sales . . . 70,810 119,104 — (19,710) 170,204
Intercompany liabilities ........ 1,074,222 — — (1,074,222) —
Stockholders’ equity ........... 423,156 1,675,280 24,288 (1,699,568) 423,156
Total liabilities and stockholders’
equity ................... $2,226,364 $1,942,778 $200,273 $(2,817,026) $1,552,389
80