PNC Bank 2015 Annual Report Download - page 62
Download and view the complete annual report
Please find page 62 of the 2015 PNC Bank annual report below. You can navigate through the pages in the report by either clicking on the pages listed below, or by using the keyword search tool below to find specific information within the annual report.-
 1
1 -
2
-
3
-
4
-
5
-
6
-
7
-
8
-
9
-
10
-
11
-
12
-
13
-
14
-
15
-
16
-
17
-
18
-
19
-
20
-
21
-
22
-
23
-
24
-
25
-
26
-
27
-
28
-
29
-
30
-
31
-
32
-
33
-
34
-
35
-
36
-
37
-
38
-
39
-
40
-
41
-
42
-
43
-
44
-
45
-
46
-
47
-
48
-
49
-
50
-
51
-
 52
52 -
 53
53 -
 54
54 -
 55
55 -
 56
56 -
 57
57 -
 58
58 -
 59
59 -
 60
60 -
 61
61 -
 62
62 -
 63
63 -
 64
64 -
 65
65 -
 66
66 -
 67
67 -
 68
68 -
 69
69 -
 70
70 -
 71
71 -
 72
72 -
73
-
74
-
75
-
76
-
77
-
78
-
79
-
80
-
81
-
82
-
83
-
84
-
85
-
86
-
87
-
88
-
89
-
90
-
91
-
92
-
93
-
94
-
95
-
96
-
97
-
98
-
99
-
100
-
101
-
102
-
103
-
104
-
105
-
106
-
107
-
108
-
109
-
110
-
111
-
112
-
113
-
114
-
115
-
116
-
117
-
118
-
119
-
120
-
121
-
122
-
123
-
124
-
125
-
126
-
127
-
128
-
129
-
130
-
131
-
132
-
133
-
134
-
135
-
136
-
137
-
138
-
139
-
140
-
141
-
142
-
143
-
144
-
145
-
146
-
147
-
148
-
149
-
150
-
151
-
152
-
153
-
154
-
155
-
156
-
157
-
158
-
159
-
160
-
161
-
162
-
163
-
164
-
165
-
166
-
167
-
168
-
169
-
170
-
171
-
172
-
173
-
174
-
175
-
176
-
177
-
178
-
179
-
180
-
181
-
182
-
183
-
184
-
185
-
186
-
187
-
188
-
189
-
190
-
191
-
192
-
193
-
194
-
195
-
196
-
197
-
198
-
199
-
200
-
201
-
202
-
203
-
204
-
205
-
206
-
207
-
208
-
209
-
210
-
211
-
212
-
213
-
214
-
215
-
216
-
217
-
218
-
219
-
220
-
221
-
222
-
223
-
224
-
225
-
226
-
227
-
228
-
229
-
230
-
231
-
232
-
233
-
234
-
235
-
236
-
237
-
238
-
239
-
240
-
241
-
242
-
243
-
244
-
245
-
246
-
247
-
248
-
249
-
250
-
251
-
252
-
253
-
254
-
255
-
256
 |
 |

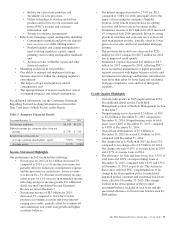
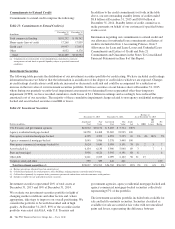
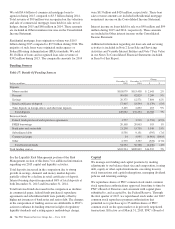
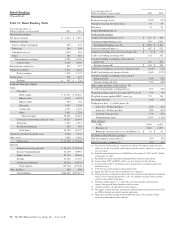
Commitments to Extend Credit
Commitments to extend credit comprise the following:
Table 13: Commitments to Extend Credit (a)
In millions
December 31
2015
December 31
2014
Total commercial lending $101,252 $ 98,742
Home equity lines of credit 17,268 17,839
Credit card 19,937 17,833
Other 4,032 4,178
Total $142,489 $138,592
(a) Commitments to extend credit, or net unfunded loan commitments, represent
arrangements to lend funds or provide liquidity subject to specified contractual
conditions.
In addition to the credit commitments set forth in the table
above, our net outstanding standby letters of credit totaled
$8.8 billion at December 31, 2015 and $10.0 billion at
December 31, 2014. Standby letters of credit commit us to
make payments on behalf of our customers if specified future
events occur.
Information regarding our commitments to extend credit and
our allowance for unfunded loan commitments and letters of
credit is included in Note 1 Accounting Policies, Note 5
Allowances for Loan and Lease Losses and Unfunded Loan
Commitments and Letters of Credit and Note 21
Commitments and Guarantees in the Notes To Consolidated
Financial Statements in Item 8 of this Report.
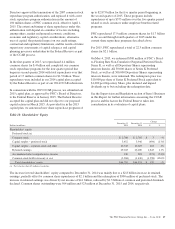
Investment Securities
The following table presents the distribution of our investment securities portfolio by credit rating. We have included credit ratings
information because we believe that the information is an indicator of the degree of credit risk to which we are exposed. Changes
in credit ratings classifications could indicate increased or decreased credit risk and could be accompanied by a reduction or
increase in the fair value of our investment securities portfolio. For those securities on our balance sheet at December 31, 2015,
where during our quarterly security-level impairment assessments we determined losses represented other-than-temporary
impairment (OTTI), we have recorded cumulative credit losses of $1.1 billion in earnings and accordingly have reduced the
amortized cost of our securities. The majority of these cumulative impairment charges related to non-agency residential mortgage-
backed and asset-backed securities rated BB or lower.
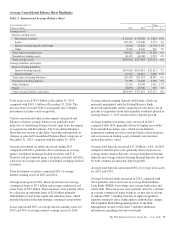
Table 14: Investment Securities
December 31, 2015 December 31, 2014
Ratings (a)
As of December 31, 2015
Dollars in millions
Amortized
Cost
Fair
Value
Amortized
Cost
Fair
Value
AAA/
AA A BBB
BB
and
Lower
No
Rating
U.S. Treasury and government agencies $10,022 $10,172 $ 5,485 $ 5,714 100%
Agency residential mortgage-backed 34,250 34,408 23,382 23,935 100
Non-agency residential mortgage-backed 4,225 4,392 4,993 5,225 10 1% 4% 80% 5%
Agency commercial mortgage-backed 3,045 3,086 3,378 3,440 100
Non-agency commercial mortgage-backed (b) 5,624 5,630 5,095 5,191 78 10 2 3 7
Asset-backed (c) 6,134 6,130 5,900 5,940 89 3 7 1
State and municipal 3,936 4,126 3,995 4,191 88 6 6
Other debt 2,211 2,229 2,099 2,142 56 31 13
Corporate stock and other 590 589 442 441 100
Total investment securities (d) $70,037 $70,762 $54,769 $56,219 89% 2% 1% 6% 2%
(a) Ratings percentages allocated based on amortized cost.
(b) Collateralized primarily by retail properties, office buildings, lodging properties and multi-family housing.
(c) Collateralized primarily by corporate debt, government guaranteed student loans and other consumer credit products.
(d) Includes available for sale and held to maturity securities.
Investment securities represented 20% of total assets at
December 31, 2015 and 16% at December 31, 2014.
We evaluate our investment securities portfolio in light of
changing market conditions and other factors and, where
appropriate, take steps to improve our overall positioning. We
consider the portfolio to be well-diversified and of high
quality. At December 31, 2015, 89% of the securities in the
portfolio were rated AAA/AA, with U.S. Treasury and
government agencies, agency residential mortgage-backed and
agency commercial mortgage-backed securities collectively
representing 67% of the portfolio.
The investment securities portfolio includes both available for
sale and held to maturity securities. Securities classified as
available for sale are carried at fair value with net unrealized
gains and losses, representing the difference between
44 The PNC Financial Services Group, Inc. – Form 10-K