PNC Bank 2015 Annual Report Download - page 101
Download and view the complete annual report
Please find page 101 of the 2015 PNC Bank annual report below. You can navigate through the pages in the report by either clicking on the pages listed below, or by using the keyword search tool below to find specific information within the annual report.-
 1
1 -
2
-
3
-
4
-
5
-
6
-
7
-
8
-
9
-
10
-
11
-
12
-
13
-
14
-
15
-
16
-
17
-
18
-
19
-
20
-
21
-
22
-
23
-
24
-
25
-
26
-
27
-
28
-
29
-
30
-
31
-
32
-
33
-
34
-
35
-
36
-
37
-
38
-
39
-
40
-
41
-
42
-
43
-
44
-
45
-
46
-
47
-
48
-
49
-
50
-
51
-
52
-
53
-
54
-
55
-
56
-
57
-
58
-
59
-
60
-
61
-
62
-
63
-
64
-
65
-
66
-
67
-
68
-
69
-
70
-
71
-
72
-
73
-
74
-
75
-
76
-
77
-
78
-
79
-
80
-
81
-
82
-
83
-
84
-
85
-
86
-
87
-
88
-
89
-
90
-
 91
91 -
 92
92 -
 93
93 -
 94
94 -
 95
95 -
 96
96 -
 97
97 -
 98
98 -
 99
99 -
 100
100 -
 101
101 -
 102
102 -
 103
103 -
 104
104 -
 105
105 -
 106
106 -
 107
107 -
 108
108 -
 109
109 -
 110
110 -
 111
111 -
112
-
113
-
114
-
115
-
116
-
117
-
118
-
119
-
120
-
121
-
122
-
123
-
124
-
125
-
126
-
127
-
128
-
129
-
130
-
131
-
132
-
133
-
134
-
135
-
136
-
137
-
138
-
139
-
140
-
141
-
142
-
143
-
144
-
145
-
146
-
147
-
148
-
149
-
150
-
151
-
152
-
153
-
154
-
155
-
156
-
157
-
158
-
159
-
160
-
161
-
162
-
163
-
164
-
165
-
166
-
167
-
168
-
169
-
170
-
171
-
172
-
173
-
174
-
175
-
176
-
177
-
178
-
179
-
180
-
181
-
182
-
183
-
184
-
185
-
186
-
187
-
188
-
189
-
190
-
191
-
192
-
193
-
194
-
195
-
196
-
197
-
198
-
199
-
200
-
201
-
202
-
203
-
204
-
205
-
206
-
207
-
208
-
209
-
210
-
211
-
212
-
213
-
214
-
215
-
216
-
217
-
218
-
219
-
220
-
221
-
222
-
223
-
224
-
225
-
226
-
227
-
228
-
229
-
230
-
231
-
232
-
233
-
234
-
235
-
236
-
237
-
238
-
239
-
240
-
241
-
242
-
243
-
244
-
245
-
246
-
247
-
248
-
249
-
250
-
251
-
252
-
253
-
254
-
255
-
256
 |
 |
obtain cost-effective funding to meet current and future
obligations under both normal “business as usual” and
stressful circumstances, and to help ensure that we maintain
an appropriate level of contingent liquidity.
Management monitors liquidity through a series of early
warning indicators that may indicate a potential market, or
PNC-specific, liquidity stress event. In addition, management
performs a set of liquidity stress tests over multiple time
horizons with varying levels of severity and maintains a
contingency funding plan to address a potential stress event. In
the most severe liquidity stress simulation, we assume that
PNC’s liquidity position is under pressure, while the market in
general is under systemic pressure. The simulation considers,
among other things, the impact of restricted access to both
secured and unsecured external sources of funding, accelerated
run-off of customer deposits, valuation pressure on assets and
heavy demand to fund contingent obligations. Parent company
liquidity guidelines are designed to help ensure that sufficient
liquidity is available to meet our parent company obligations
over the succeeding 24-month period. Liquidity-related risk
limits are established within our Enterprise Liquidity
Management Policy and supporting policies. Management
committees, including the Asset and Liability Committee, and
the Board of Directors and its Risk Committee regularly review
compliance with key established limits.
In addition to these liquidity monitoring measures and tools
described above, PNC also monitors its liquidity by reference
to the LCR, a regulatory minimum liquidity requirement
designed to ensure that covered banking organizations
maintain an adequate level of liquidity to meet net liquidity
needs over the course of a 30-day stress scenario. The LCR is
calculated by dividing the amount of an institution’s high
quality, unencumbered liquid assets (HQLA), as defined and
calculated in accordance with the LCR rules, by its estimated
net cash outflow, with net cash outflows determined by
applying the assumed outflow factors in the LCR rules. The
resulting quotient is expressed as a percentage. For PNC and
PNC Bank, the LCR became effective January 1, 2015. The
minimum required LCR will be phased-in over a period of
years. The minimum LCR that PNC and PNC Bank were
required to maintain was 80% in 2015 and such minimum
increased to 90% in 2016. Between January 1, 2016 and
June 30, 2016, PNC and PNC Bank are required to calculate
the LCR on a month-end basis. Effective July 1, 2016, PNC
and PNC Bank must begin calculating their respective LCR
ratios on a daily basis.
As of December 31, 2015, the LCR for PNC and PNC Bank
exceeded 100 percent. The December 31, 2015 LCR
calculation and the underlying components are based on
PNC’s current interpretation and understanding of the final
LCR rules and are subject to, among other things, further
regulatory guidance.
We provide additional information regarding regulatory
liquidity requirements and their potential impact on PNC in
the Supervision and Regulation section of Item 1 Business and
Item 1A Risk Factors of this Report.
Bank Level Liquidity – Uses
At the bank level, primary contractual obligations include
funding loan commitments, satisfying deposit withdrawal
requests and maturities and debt service related to bank
borrowings. As of December 31, 2015, there were
approximately $8.3 billion of bank borrowings with
contractual maturities of less than one year, including $1.8
billion in borrowings from an affiliate. We also maintain
adequate bank liquidity to meet future potential loan demand
and provide for other business needs, as necessary.
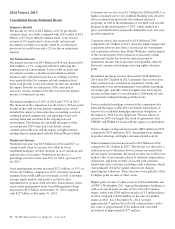
Bank Level Liquidity – Sources
Our largest source of bank liquidity on a consolidated basis is
the deposit base generated by our retail and commercial
banking businesses. Total deposits increased to $249.0 billion
at December 31, 2015 from $232.2 billion at December 31,
2014, driven primarily by growth in savings and demand
deposits. Assets determined by PNC to be liquid (liquid
assets) and unused borrowing capacity from a number of
sources are also available to maintain our liquidity position.
Borrowed funds come from a diverse mix of short-term and
long-term funding sources.
At December 31, 2015, our liquid assets consisted of short-
term investments (Federal funds sold, resale agreements,
trading securities and interest-earning deposits with banks)
totaling $33.6 billion and securities available for sale totaling
$55.8 billion. The level of liquid assets fluctuates over time
based on many factors, including market conditions, loan and
deposit growth and balance sheet management activities. Of
our total liquid assets of $89.4 billion, we had $3.2 billion of
securities available for sale and trading securities pledged as
collateral to secure public and trust deposits, repurchase
agreements and for other purposes. In addition to the liquid
assets we pledged, $6.5 billion of securities held to maturity
were also pledged as collateral for these purposes.
In addition to the customer deposit base, which has
historically provided the single largest source of relatively
stable and low-cost funding, the bank also obtains liquidity
through the issuance of traditional forms of funding, including
long-term debt (senior notes, subordinated debt and FHLB
advances) and short-term borrowings (Federal funds
purchased, securities sold under repurchase agreements,
commercial paper and other short-term borrowings).
The PNC Financial Services Group, Inc. – Form 10-K 83