O'Reilly Auto Parts 2009 Annual Report Download - page 2
Download and view the complete annual report
Please find page 2 of the 2009 O'Reilly Auto Parts annual report below. You can navigate through the pages in the report by either clicking on the pages listed below, or by using the keyword search tool below to find specific information within the annual report.-
 1
1 -
 2
2 -
 3
3 -
 4
4 -
 5
5 -
 6
6 -
 7
7 -
 8
8 -
 9
9 -
 10
10 -
 11
11 -
 12
12 -
 13
13 -
14
-
15
-
16
-
17
-
18
-
19
-
20
-
21
-
22
-
23
-
24
-
25
-
26
-
27
-
28
-
29
-
30
-
31
-
32
-
33
-
34
-
35
-
36
-
37
-
38
-
39
-
40
-
41
-
42
-
43
-
44
-
45
-
46
-
47
-
48
-
49
-
50
-
51
-
52
-
53
-
54
-
55
-
56
-
57
-
58
-
59
-
60
-
61
-
62
-
63
-
64
-
65
-
66
-
67
-
68
-
69
-
70
-
71
-
72
-
73
-
74
-
75
-
76
-
77
-
78
-
79
-
80
-
81
-
82
-
83
-
84
-
85
-
86
-
87
-
88
-
89
-
90
-
91
-
92
-
93
-
94
-
95
-
96
-
97
-
98
-
99
-
100
-
101
-
102
-
103
 |
 |

FINANCIAL HIGHLIGHTS
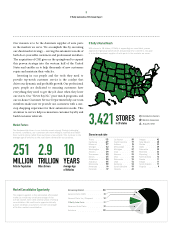
During 2009, we continued to convert our acquired CSK stores to the O’Reilly systems. We are very optimistic with the potential to
improve the sales performance of these acquired stores by implementing our proven dual market strategy in these new markets.
In thousands, except earnings per share data and operating data
years ended December 31 2009 2008 2007 2006 2005
Sales $ 4,847,062 $ 3,576,553 $ 2,522,319 $ 2,283,222 $ 2,045,318
Operating Income 537,619 335,617 305,151 282,315 252,524
Net Income 307,498 186,232 193,988 178,085 164,266
Working Capital 995,344 821,932 573,328 566,892 424,974
Total Assets 4,781,471 4,193,317 2,279,737 1,977,496 1,718,896
Total Debt 790,748 732,695 100,469 110,479 100,774
Shareholders’ Equity 2,685,865 2,282,218 1,592,477 1,364,096 1,145,769
Net Income Per Common Share
(assuming dilution) 2.23 1.48 1.67 1.55 1.45
Weight-Average Common Share
(assuming dilution) 137,882 125,413 116,080 115,119 113,385
Stores At Year-End 3,421 3,285 1,830 1,640 1,470
Same-Store Sales Gain 4.6% 1.5% 3.7% 3.3% 7.5%
Our strong vendor relationships and solid
sales results from both our “core” O’Reilly
as well as acquired CSK stores led to a 51%
increase in diluted earnings per share.
Earnings Per Share
(Assuming dilution)
‘05 ‘06 ‘07 ‘08 ‘09
2.23
1.45 1.55 1.67
1.48
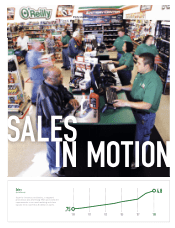
O’Reilly’s proven dual market strategy and
commitment to providing the best customer
service in the industry resulted in a 4.6%
same store sales increase.
Same-Store Sales
(Percent)
4.6
‘05 ‘06 ‘07 ‘08 ‘09
7.5
3.3 3.7
1.5
We were able to increase operating margins
18% by focusing on expense control and
hard work and by continually adapting
the product mix in each of our stores to
meet the needs of our customers.
Operating Income
(In thousands)
538
‘05 ‘06 ‘07 ‘08 ‘09
253 282 305 336