North Face 2013 Annual Report Download - page 4
Download and view the complete annual report
Please find page 4 of the 2013 North Face annual report below. You can navigate through the pages in the report by either clicking on the pages listed below, or by using the keyword search tool below to find specific information within the annual report.-
 1
1 -
 2
2 -
 3
3 -
 4
4 -
 5
5 -
 6
6 -
 7
7 -
 8
8 -
 9
9 -
 10
10 -
 11
11 -
 12
12 -
 13
13 -
 14
14 -
 15
15 -
16
-
17
-
18
-
19
-
20
-
21
-
22
-
23
-
24
-
25
-
26
-
27
-
28
-
29
-
30
-
31
-
32
-
33
-
34
-
35
-
36
-
37
-
38
-
39
-
40
 |
 |

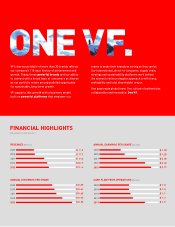
REVENUES (Billions) ANNUAL EARNINGS PER SHARE (Diluted)
ANNUAL DIVIDENDS PER SHARE CASH FLOW FROM OPERATIONS (Billions)
FINANCIAL HIGHLIGHTS
(All amounts in U.S. dollars.)
$ 7 .2
$ 7 .7
$ 9 .5
$ 10 .9
$11 .4
$ 1 .03
$ 1 .29
$ 2 .00
$ 2 .43
$ 2 .71
$ 0 .59
$ 0 .61
$ 0 .65
$ 0 .76
$ 0 .92
$ 1 . 0
$ 1 . 0
$ 1 . 1
$ 1 . 3
$ 1 . 5
2009 2009
2013 2013
2011 2011
2010 2010
2012
2009
2013
2011
2010
2012
2012
2009
2013
2011
2010
2012
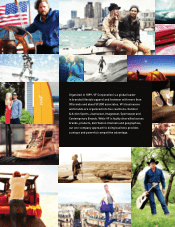
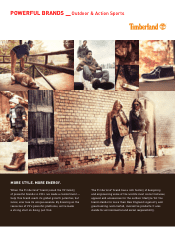
VF’s diverse portfolio of more than 30 brands reflects
our company’s 115-year history of achievement and
growth. Today, these powerful brands and our ability
to connect with a broad base of consumers as diverse
as our portfolio create an unparalleled opportunity
for sustainable, long-term growth.
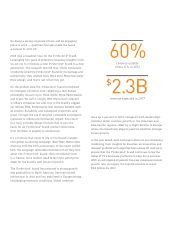
VF supports this growth with a business model
built on powerful platforms that empower our
teams to make their brands as strong as they can be.
Our international, direct-to-consumer, supply chain,
strategy and sustainability platforms work behind
the scenes to drive a singular approach to efficiency,
profitability and total shareholder return.
One passionate global team. One culture of authenticity,
collaboration and innovation. One VF.