Nokia 2009 Annual Report Download - page 99
Download and view the complete annual report
Please find page 99 of the 2009 Nokia annual report below. You can navigate through the pages in the report by either clicking on the pages listed below, or by using the keyword search tool below to find specific information within the annual report.-
 1
1 -
2
-
3
-
4
-
5
-
6
-
7
-
8
-
9
-
10
-
11
-
12
-
13
-
14
-
15
-
16
-
17
-
18
-
19
-
20
-
21
-
22
-
23
-
24
-
25
-
26
-
27
-
28
-
29
-
30
-
31
-
32
-
33
-
34
-
35
-
36
-
37
-
38
-
39
-
40
-
41
-
42
-
43
-
44
-
45
-
46
-
47
-
48
-
49
-
50
-
51
-
52
-
53
-
54
-
55
-
56
-
57
-
58
-
59
-
60
-
61
-
62
-
63
-
64
-
65
-
66
-
67
-
68
-
69
-
70
-
71
-
72
-
73
-
74
-
75
-
76
-
77
-
78
-
79
-
80
-
81
-
82
-
83
-
84
-
85
-
86
-
87
-
88
-
 89
89 -
 90
90 -
 91
91 -
 92
92 -
 93
93 -
 94
94 -
 95
95 -
 96
96 -
 97
97 -
 98
98 -
 99
99 -
 100
100 -
 101
101 -
 102
102 -
 103
103 -
 104
104 -
 105
105 -
 106
106 -
 107
107 -
 108
108 -
 109
109 -
110
-
111
-
112
-
113
-
114
-
115
-
116
-
117
-
118
-
119
-
120
-
121
-
122
-
123
-
124
-
125
-
126
-
127
-
128
-
129
-
130
-
131
-
132
-
133
-
134
-
135
-
136
-
137
-
138
-
139
-
140
-
141
-
142
-
143
-
144
-
145
-
146
-
147
-
148
-
149
-
150
-
151
-
152
-
153
-
154
-
155
-
156
-
157
-
158
-
159
-
160
-
161
-
162
-
163
-
164
-
165
-
166
-
167
-
168
-
169
-
170
-
171
-
172
-
173
-
174
-
175
-
176
-
177
-
178
-
179
-
180
-
181
-
182
-
183
-
184
-
185
-
186
-
187
-
188
-
189
-
190
-
191
-
192
-
193
-
194
-
195
-
196
-
197
-
198
-
199
-
200
-
201
-
202
-
203
-
204
-
205
-
206
-
207
-
208
-
209
-
210
-
211
-
212
-
213
-
214
-
215
-
216
-
217
-
218
-
219
-
220
-
221
-
222
-
223
-
224
-
225
-
226
-
227
-
228
-
229
-
230
-
231
-
232
-
233
-
234
-
235
-
236
-
237
-
238
-
239
-
240
-
241
-
242
-
243
-
244
-
245
-
246
-
247
-
248
-
249
-
250
-
251
-
252
-
253
-
254
-
255
-
256
-
257
-
258
-
259
-
260
-
261
-
262
-
263
-
264
 |
 |

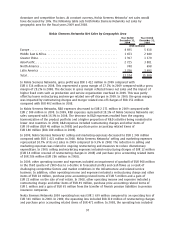
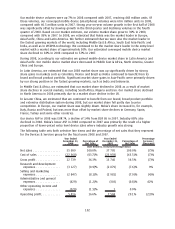
downturn and competitive factors. At constant currency, Nokia Siemens Networks’ net sales would
have decreased by 16%. The following table sets forth Nokia Siemens Networks net sales by
geographic area for the fiscal years 2009 and 2008.
Nokia Siemens Networks Net Sales by Geographic Area
Year Ended
December 31,
2009
Year Ended
December 31,
2008
(EUR millions)
Europe ...................................................... 4695 5618
Middle East & Africa............................................ 1653 2040
Greater China ................................................. 1397 1379
AsiaPacific................................................... 2725 3881
North America ................................................ 748 698
Latin America ................................................ 1356 1693
Total........................................................ 12574 15309
In Nokia Siemens Networks, gross profit was EUR 3 412 million in 2009 compared with
EUR 4 316 million in 2008. This represented a gross margin of 27.1% in 2009 compared with a gross
margin of 28.2% in 2008. The decrease in gross margin reflected lower net sales and the impact of
higher fixed costs such as production and service organization overhead in 2009. This was partly
offset by lower restructuring and merger related oneoff charges in 2009. In 2009, the gross margin
was impacted by restructuring charges and merger related oneoff charges of EUR 151 million
compared with EUR 402 million in 2008.
In Nokia Siemens Networks, R&D expenses decreased to EUR 2 271 million in 2009 compared with
EUR 2 500 million in 2008. In 2009, R&D expenses represented 18.1% of Nokia Siemens Networks net
sales compared with 16.3% in 2008. The decrease in R&D expenses resulted from the ongoing
harmonization of the product portfolio and a higher proportion of R&D activities being conducted in
lower cost countries. In 2009, R&D expenses included restructuring charges and other items of
EUR 30 million (EUR 46 million in 2008) and purchase price accounting related items of
EUR 180 million (EUR 180 million in 2008).
In 2009, Nokia Siemens Networks’ selling and marketing expenses decreased to EUR 1 349 million
compared with EUR 1 421 million in 2008. Nokia Siemens Networks’ selling and marketing expenses
represented 10.7% of its net sales in 2009 compared to 9.3% in 2008. The reduction in selling and
marketing expenses was related to ongoing restructuring and measures to reduce discretionary
expenditure. In 2009, selling and marketing expenses included restructuring charges of EUR 12 million
(EUR 14 million reversal of restructuring charges in 2008) and purchase price accounting related items
of EUR 286 million (EUR 286 million in 2008).
In 2009, other operating income and expenses included an impairment of goodwill of EUR 908 million
in the third quarter of 2009 due to a decline in forecasted profits and cash flows as a result of
challenging competitive factors and market conditions in the infrastructure and related service
business. In addition, other operating income and expenses included a restructuring charge and other
items of EUR 14 million, purchase price accounting related items of EUR 5 million and a gain of
EUR 22 million on the sale of real estate. In 2008, other operating income and expenses included a
restructuring charge and other items of EUR 49 million, purchase price accounting related items of
EUR 1 million and a gain of EUR 65 million from the transfer of Finnish pension liabilities to pension
insurance companies.
Nokia Siemens Networks 2009 operating loss was EUR 1 639 million compared to an operating loss of
EUR 301 million in 2008. In 2009, the operating loss included EUR 310 million of restructuring charges
and purchase price accounting related items of EUR 471 million. In 2008, the operating loss included
97