Nokia 2009 Annual Report Download - page 93
Download and view the complete annual report
Please find page 93 of the 2009 Nokia annual report below. You can navigate through the pages in the report by either clicking on the pages listed below, or by using the keyword search tool below to find specific information within the annual report.-
 1
1 -
2
-
3
-
4
-
5
-
6
-
7
-
8
-
9
-
10
-
11
-
12
-
13
-
14
-
15
-
16
-
17
-
18
-
19
-
20
-
21
-
22
-
23
-
24
-
25
-
26
-
27
-
28
-
29
-
30
-
31
-
32
-
33
-
34
-
35
-
36
-
37
-
38
-
39
-
40
-
41
-
42
-
43
-
44
-
45
-
46
-
47
-
48
-
49
-
50
-
51
-
52
-
53
-
54
-
55
-
56
-
57
-
58
-
59
-
60
-
61
-
62
-
63
-
64
-
65
-
66
-
67
-
68
-
69
-
70
-
71
-
72
-
73
-
74
-
75
-
76
-
77
-
78
-
79
-
80
-
81
-
82
-
 83
83 -
 84
84 -
 85
85 -
 86
86 -
 87
87 -
 88
88 -
 89
89 -
 90
90 -
 91
91 -
 92
92 -
 93
93 -
 94
94 -
 95
95 -
 96
96 -
 97
97 -
 98
98 -
 99
99 -
 100
100 -
 101
101 -
 102
102 -
 103
103 -
104
-
105
-
106
-
107
-
108
-
109
-
110
-
111
-
112
-
113
-
114
-
115
-
116
-
117
-
118
-
119
-
120
-
121
-
122
-
123
-
124
-
125
-
126
-
127
-
128
-
129
-
130
-
131
-
132
-
133
-
134
-
135
-
136
-
137
-
138
-
139
-
140
-
141
-
142
-
143
-
144
-
145
-
146
-
147
-
148
-
149
-
150
-
151
-
152
-
153
-
154
-
155
-
156
-
157
-
158
-
159
-
160
-
161
-
162
-
163
-
164
-
165
-
166
-
167
-
168
-
169
-
170
-
171
-
172
-
173
-
174
-
175
-
176
-
177
-
178
-
179
-
180
-
181
-
182
-
183
-
184
-
185
-
186
-
187
-
188
-
189
-
190
-
191
-
192
-
193
-
194
-
195
-
196
-
197
-
198
-
199
-
200
-
201
-
202
-
203
-
204
-
205
-
206
-
207
-
208
-
209
-
210
-
211
-
212
-
213
-
214
-
215
-
216
-
217
-
218
-
219
-
220
-
221
-
222
-
223
-
224
-
225
-
226
-
227
-
228
-
229
-
230
-
231
-
232
-
233
-
234
-
235
-
236
-
237
-
238
-
239
-
240
-
241
-
242
-
243
-
244
-
245
-
246
-
247
-
248
-
249
-
250
-
251
-
252
-
253
-
254
-
255
-
256
-
257
-
258
-
259
-
260
-
261
-
262
-
263
-
264
 |
 |
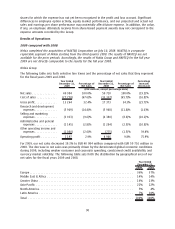
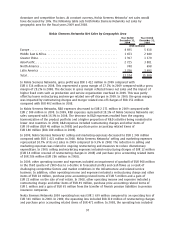
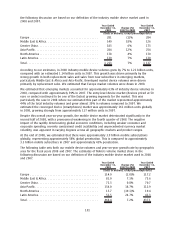
The 10 markets in which we generated the greatest net sales in 2009 were, in descending order of
magnitude, China, India, the United Kingdom, Germany, the United States, Russia, Indonesia, Spain,
Brazil and Italy, together representing approximately 52% of our total net sales in 2009. In
comparison, the 10 markets in which we generated the greatest net sales in 2008 were China, India,
the UK, Germany, Russia, Indonesia, the US, Brazil, Italy and Spain, together representing
approximately 50% of our total net sales in 2008.
Our gross margin in 2009 was 32.4% compared with 34.3% in 2008. The lower gross margin in 2009
resulted primarily from the decrease in net sales compared to 2008.
Research and development, or R&D, expenses were EUR 5 909 million, down 1% from EUR 5 968
million in 2008. R&D expenses represented 14.4% of our net sales in 2009, up from 11.8% in 2008.
The increase in R&D as a percentage of net sales reflected a decrease in net sales in Devices &
Services and Nokia Siemens Networks which was partially offset by a decrease in R&D expenses in
Devices & Services and Nokia Siemens Networks. In 2009, R&D expenses included restructuring
charges of EUR 30 million and purchase price accounting related items of EUR 534 million. In 2008,
R&D expenses included EUR 153 million representing the contribution of the assets to the Symbian
Foundation, restructuring charges of EUR 46 million and purchase price accounting related items of
EUR 351 million.
In 2009, selling and marketing expenses were EUR 3 933 million compared with EUR 4 380 million in
2008. Selling and marketing expenses represented 9.6% of our net sales in 2009, up from 8.6% in
2008. The increase in selling and marketing expenses as a percentage of net sales reflected a
decrease in net sales in Devices & Services and Nokia Siemens Networks which was partially offset by
a decrease in sales and marketing expenses in Devices & Services. In 2009, selling and marketing
expenses included restructuring charges of EUR 12 million and EUR 401 million of purchase price
accounting related items. In 2008, selling and marketing expenses included a EUR 14 million reversal
of restructuring charges and EUR 343 million of purchase price accounting related items.
Administrative and general expenses were EUR 1 145 million in 2009 and EUR 1 284 million in 2008.
Administrative and general expenses were 2.8% of net sales in 2009 compared to 2.5% in 2008.
Administrative and general expenses in 2009 included restructuring charges of EUR 103 million.
Administrative and general expenses for 2008 also included restructuring charges of EUR 163 million.
In 2009, other income and expenses included restructuring charges of EUR 192 million, purchase price
accounting related items of EUR 5 million, impairment of goodwill related to Nokia Siemens Networks
of EUR 908 million, impairment of assets of EUR 56 million, a gain on sale of the security appliance
business of EUR 68 million and a gain on sale of real estate of EUR 22 million in 2009. In 2008, other
operating income and expenses included restructuring charges of EUR 446 million and EUR 152
million loss due to transfer of the Finnish pension liabilities to pension insurance companies.
Our operating profit for 2009 decreased 76% to EUR 1 197 million compared with EUR 4 966 million
in 2008. The decreased operating profit resulted from decreased profitability of all reportable
segments. Our operating margin was 2.9% in 2009 compared with 9.8% in 2008.
91