Nokia 2009 Annual Report Download - page 225
Download and view the complete annual report
Please find page 225 of the 2009 Nokia annual report below. You can navigate through the pages in the report by either clicking on the pages listed below, or by using the keyword search tool below to find specific information within the annual report.-
 1
1 -
2
-
3
-
4
-
5
-
6
-
7
-
8
-
9
-
10
-
11
-
12
-
13
-
14
-
15
-
16
-
17
-
18
-
19
-
20
-
21
-
22
-
23
-
24
-
25
-
26
-
27
-
28
-
29
-
30
-
31
-
32
-
33
-
34
-
35
-
36
-
37
-
38
-
39
-
40
-
41
-
42
-
43
-
44
-
45
-
46
-
47
-
48
-
49
-
50
-
51
-
52
-
53
-
54
-
55
-
56
-
57
-
58
-
59
-
60
-
61
-
62
-
63
-
64
-
65
-
66
-
67
-
68
-
69
-
70
-
71
-
72
-
73
-
74
-
75
-
76
-
77
-
78
-
79
-
80
-
81
-
82
-
83
-
84
-
85
-
86
-
87
-
88
-
89
-
90
-
91
-
92
-
93
-
94
-
95
-
96
-
97
-
98
-
99
-
100
-
101
-
102
-
103
-
104
-
105
-
106
-
107
-
108
-
109
-
110
-
111
-
112
-
113
-
114
-
115
-
116
-
117
-
118
-
119
-
120
-
121
-
122
-
123
-
124
-
125
-
126
-
127
-
128
-
129
-
130
-
131
-
132
-
133
-
134
-
135
-
136
-
137
-
138
-
139
-
140
-
141
-
142
-
143
-
144
-
145
-
146
-
147
-
148
-
149
-
150
-
151
-
152
-
153
-
154
-
155
-
156
-
157
-
158
-
159
-
160
-
161
-
162
-
163
-
164
-
165
-
166
-
167
-
168
-
169
-
170
-
171
-
172
-
173
-
174
-
175
-
176
-
177
-
178
-
179
-
180
-
181
-
182
-
183
-
184
-
185
-
186
-
187
-
188
-
189
-
190
-
191
-
192
-
193
-
194
-
195
-
196
-
197
-
198
-
199
-
200
-
201
-
202
-
203
-
204
-
205
-
206
-
207
-
208
-
209
-
210
-
211
-
212
-
213
-
214
-
 215
215 -
 216
216 -
 217
217 -
 218
218 -
 219
219 -
 220
220 -
 221
221 -
 222
222 -
 223
223 -
 224
224 -
 225
225 -
 226
226 -
 227
227 -
 228
228 -
 229
229 -
 230
230 -
 231
231 -
 232
232 -
 233
233 -
 234
234 -
 235
235 -
236
-
237
-
238
-
239
-
240
-
241
-
242
-
243
-
244
-
245
-
246
-
247
-
248
-
249
-
250
-
251
-
252
-
253
-
254
-
255
-
256
-
257
-
258
-
259
-
260
-
261
-
262
-
263
-
264
 |
 |

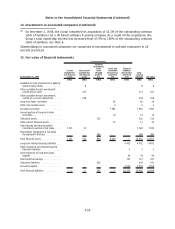
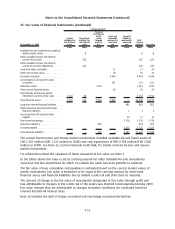
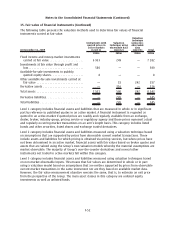
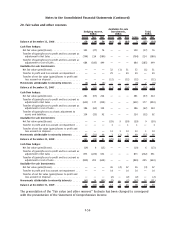
15. Fair value of financial instruments (Continued)
At December 31, 2008
Current
availablefor
sale financial
assets
Noncurrent
availablefor
sale financial
assets
Financial
instruments
at fair
value
through
profit or
loss
Loans and
receivables
measured at
amortised
cost
Financial
liabilities
measured at
amortised
cost
Carrying amounts
Total
carrying
amounts Fair value
EURm EURm EURm EURm EURm EURm EURm
Availableforsale investments in publicly
quoted equity shares ............ 8 8 8
Other availableforsale investments
carried at fair value ............. 225 225 225
Other availableforsale investments
carried at cost less impairment ..... 241 241 241
Longterm loans receivable.......... 27 27 24
Other noncurrent assets ........... 10 10 10
Accounts receivable ............... 9444 9444 9444
Current portion of longterm loans
receivable .................... 101 101 101
Derivative assets ................. 1014 1014 1014
Other current financial assets ........ 20 20 20
Fixed income and moneymarket
investments carried at fair value .... 5114 38 5152 5152
Total financial assets .............. 5114 512 1014 9602 — 16242 16239
Longterm interestbearing liabilities . . . 861 861 855
Other long term noninterest bearing
financial liabilities .............. 3 3 3
Current portion of longterm loans
payable ..................... 13 13 13
Shortterm borrowings ............ 3578 3578 3578
Derivative liabilities .............. 924 924 924
Accounts payable ................ 5225 5225 5225
Total financial liabilities ............ — — 924 — 9680 10604 10598
The current fixed income and money market investments included availableforsale liquid assets of
EUR 2 367 million (EUR 1 272 million in 2008) and cash equivalents of EUR 4 784 million (EUR 3 842
million in 2008). See Note 33, section Financial Credit Risk, for details on fixed income and money
market investments.
For information about the valuation of items measured at fair value see Note 1.
In the tables above fair value is set to carrying amount for other availableforsale investments
carried at cost less impairment for which no reliable fair value has been possible to estimate.
The fair value of loan receivables and payables is estimated based on the current market values of
similar instruments. Fair value is estimated to be equal to the carrying amount for shortterm
financial assets and financial liabilities due to limited credit risk and short time to maturity.
The amount of change in the fair value of investments designated at fair value through profit and
loss attributable to changes in the credit risk of the assets was deemed inconsequential during 2009.
Fair value changes that are attributable to changes in market conditions are calculated based on
relevant benchmark interest rates.
Note 16 includes the split of hedge accounted and nonhedge accounted derivatives.
F51
Notes to the Consolidated Financial Statements (Continued)