Nokia 2004 Annual Report Download - page 62
Download and view the complete annual report
Please find page 62 of the 2004 Nokia annual report below. You can navigate through the pages in the report by either clicking on the pages listed below, or by using the keyword search tool below to find specific information within the annual report.-
 1
1 -
2
-
3
-
4
-
5
-
6
-
7
-
8
-
9
-
10
-
11
-
12
-
13
-
14
-
15
-
16
-
17
-
18
-
19
-
20
-
21
-
22
-
23
-
24
-
25
-
26
-
27
-
28
-
29
-
30
-
31
-
32
-
33
-
34
-
35
-
36
-
37
-
38
-
39
-
40
-
41
-
42
-
43
-
44
-
45
-
46
-
47
-
48
-
49
-
50
-
51
-
 52
52 -
 53
53 -
 54
54 -
 55
55 -
 56
56 -
 57
57 -
 58
58 -
 59
59 -
 60
60 -
 61
61 -
 62
62 -
 63
63 -
 64
64 -
 65
65 -
 66
66 -
 67
67 -
 68
68 -
 69
69 -
 70
70 -
 71
71 -
 72
72 -
73
-
74
-
75
-
76
-
77
-
78
-
79
-
80
-
81
-
82
-
83
-
84
-
85
-
86
-
87
-
88
-
89
-
90
-
91
-
92
-
93
-
94
-
95
-
96
-
97
-
98
-
99
-
100
-
101
-
102
-
103
-
104
-
105
-
106
-
107
-
108
-
109
-
110
-
111
-
112
-
113
-
114
-
115
-
116
-
117
-
118
-
119
-
120
-
121
-
122
-
123
-
124
-
125
-
126
-
127
-
128
-
129
-
130
-
131
-
132
-
133
-
134
-
135
-
136
-
137
-
138
-
139
-
140
-
141
-
142
-
143
-
144
-
145
-
146
-
147
-
148
-
149
-
150
-
151
-
152
-
153
-
154
-
155
-
156
-
157
-
158
-
159
-
160
-
161
-
162
-
163
-
164
-
165
-
166
-
167
-
168
-
169
-
170
-
171
-
172
-
173
-
174
-
175
-
176
-
177
-
178
-
179
-
180
-
181
-
182
-
183
-
184
-
185
-
186
-
187
-
188
-
189
-
190
-
191
-
192
-
193
-
194
-
195
 |
 |

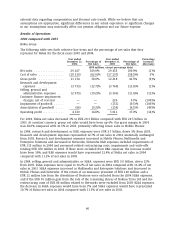
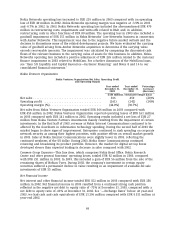
Nokia Group’s operating profit for 2004 decreased 14% to EUR 4 330 million compared with
EUR 5 011 million in 2003 primarily due to the lower profitability in Mobile Phones partly offset
by improved operating profit in Networks and Multimedia. Our operating margin was 14.8% in
2004 compared with 17.0% in 2003.
Results by Segments
Mobile Phones
The following table sets forth selective line items and the percentage of net sales that they
represent for the Mobile Phones business group for the fiscal years 2003 and 2004.
Year ended Year ended Percentage
December 31, Percentage of December 31, Percentage of Increase/
2004 Net Sales 2003 Net Sales (decrease)
(EUR millions, except percentage data)
Net sales .................. 18 507 100.0% 20 951 100.0% (12)%
Cost of sales ................ (12 057) (65.1)% (11 935) (57.0)% 1%
Gross profit ................ 6 450 34.9% 9 016 43.0% (28)%
Research and development
expenses ................. (1 189) (6.4)% (1 022) (4.9)% 16%
Selling, general and
administrative expenses .... (1 416) (7.7)% (1 985) (9.4)% (29)%
Amortization of goodwill ..... (77) (0.4)% (82) (0.4)% (6)%
Operating profit ............. 3 768 20.4% 5 927 28.3% (36)%
Mobile Phones business group 2004 net sales decreased 12% to EUR 18.5 billion compared with
EUR 21.0 billion in 2003. At constant currency, Mobile Phones business group net sales would have
decreased by 5%. Despite an increase in volumes, sales were negatively impacted by a decline in
prices. In the second quarter of 2004, we reduced the prices of certain of our products, which
contributed to our stated aim of improving our market share sequentially towards the end of the
year, but adversely impacted sales for the remainder of 2004. In addition, while our product mix
started to improve towards the end of the year, this only partially offset the negative impact of
the price reductions and our mix being more weighted towards the low end entry phones in low
penetration markets during the earlier part of the year. A significantly weaker US dollar also
negatively impacted Mobile Phones net sales during 2004 compared with 2003.
Mobile Phones 2004 gross profit decreased by 28% to EUR 6 450 million compared with EUR 9 016
million in 2003 primarily as a result of lower net sales while we were not able to reduce product
costs at the same rate. This represented a gross margin of 34.9% in 2004 compared with a gross
margin of 43.0% in 2003.
Mobile Phones 2004 R&D expenses increased by 16% to EUR 1 189 million with the target to bring
more new competitive products to the market, compared with EUR 1 022 million in 2003. In 2004
R&D expenses represented 6.4% of Mobile Phones net sales compared with 4.9% of its net sales in
2003.
In 2004, Mobile Phones SG&A expenses decreased by 29% to EUR 1 416 million as a result of lower
marketing and advertising expenses partially due to delays in ramp-ups of new products and
postponed marketing campaigns, compared with EUR 1 985 million in 2003. In 2004, SG&A
expenses represented 7.7% of Mobile Phones net sales compared with 9.4% of Mobile Phones net
sales in 2003.
61