Nokia 2004 Annual Report Download - page 192
Download and view the complete annual report
Please find page 192 of the 2004 Nokia annual report below. You can navigate through the pages in the report by either clicking on the pages listed below, or by using the keyword search tool below to find specific information within the annual report.-
 1
1 -
2
-
3
-
4
-
5
-
6
-
7
-
8
-
9
-
10
-
11
-
12
-
13
-
14
-
15
-
16
-
17
-
18
-
19
-
20
-
21
-
22
-
23
-
24
-
25
-
26
-
27
-
28
-
29
-
30
-
31
-
32
-
33
-
34
-
35
-
36
-
37
-
38
-
39
-
40
-
41
-
42
-
43
-
44
-
45
-
46
-
47
-
48
-
49
-
50
-
51
-
52
-
53
-
54
-
55
-
56
-
57
-
58
-
59
-
60
-
61
-
62
-
63
-
64
-
65
-
66
-
67
-
68
-
69
-
70
-
71
-
72
-
73
-
74
-
75
-
76
-
77
-
78
-
79
-
80
-
81
-
82
-
83
-
84
-
85
-
86
-
87
-
88
-
89
-
90
-
91
-
92
-
93
-
94
-
95
-
96
-
97
-
98
-
99
-
100
-
101
-
102
-
103
-
104
-
105
-
106
-
107
-
108
-
109
-
110
-
111
-
112
-
113
-
114
-
115
-
116
-
117
-
118
-
119
-
120
-
121
-
122
-
123
-
124
-
125
-
126
-
127
-
128
-
129
-
130
-
131
-
132
-
133
-
134
-
135
-
136
-
137
-
138
-
139
-
140
-
141
-
142
-
143
-
144
-
145
-
146
-
147
-
148
-
149
-
150
-
151
-
152
-
153
-
154
-
155
-
156
-
157
-
158
-
159
-
160
-
161
-
162
-
163
-
164
-
165
-
166
-
167
-
168
-
169
-
170
-
171
-
172
-
173
-
174
-
175
-
176
-
177
-
178
-
179
-
180
-
181
-
 182
182 -
 183
183 -
 184
184 -
 185
185 -
 186
186 -
 187
187 -
 188
188 -
 189
189 -
 190
190 -
 191
191 -
 192
192 -
 193
193 -
 194
194 -
 195
195
 |
 |

Notes to the Consolidated Financial Statements (Continued)
37. Differences between International Financial Reporting Standards and U.S. Generally
Accepted Accounting Principles (Continued)
The objective of the investment activities is to maximize the excess of plan assets over projected
benefit obligations, within an accepted risk level, taking into account the interest rate and
inflation sensitivity of the assets as well as the obligations. As of December 31, 2004 the target
asset allocation for both domestic and foreign plans was 100% long dated debt securities. In
addition, a risk limit has been approved to tactically deviate from the target asset allocation. The
Pension Committee of the Group, consisting for the CFO, Head of Group Treasury, Head of HR and
other HR representatives, approves both the target asset allocation and the deviation limit.
Derivative instruments can be used to change the portfolio asset allocation and risk characteristics.
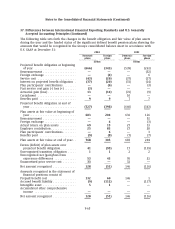
Weighted average assumptions used in calculation of the Domestic and Foreign plans’ net periodic
benefit cost for years ending December 31, are as follows:
2004 2003
Domestic Foreign Domestic Foreign
%%%%
Discount rate for determining present values ............. 5.25 5.30 5.50 5.58
Expected long-term rate of return on plan assets .......... 6.00 6.87 7.25 6.56
Annual rate of increase in future compensation levels ...... 3.50 3.49 3.50 3.09
Pension increases ................................... 2.30 2.27 2.30 2.29
The assumption for weighted average expected return on plan assets is based on the target asset
allocation at the beginning of the year as well as the expected deviation limit utilization. The
expected returns for the various asset classes are based on 1) a general inflation expectation and
2) asset class specific long-term historical real returns, which are assumed to be indicative of
future expectations without requiring further adjustments.
Estimated future benefits payments, which reflect expected future service, as appropriate, are
expected to be paid as follows:
Domestic Foreign
Pension Pension
Benefits Benefits
EURm EURm
2005 ............................................................. 11 8
2006 ............................................................. 13 9
2007 ............................................................. 15 9
2008 ............................................................. 18 10
2009 ............................................................. 19 10
Years 2010-2014 ................................................... 129 61
Foreign currency translation
Net foreign exchange gains/(losses) of EUR (54) million, EUR 182 million and EUR (63) million were
included in the determination of U.S. GAAP net income, of which EUR (345) million, EUR (717)
million and EUR (476) million were included in cost of sales for the year ended December 31,
2004, 2003, and 2002, respectively. EUR 283 million, EUR 867 million and EUR 442 million of the
net foreign exchange gains/(losses) were included in the determination of net sales in 2004, 2003
and 2002, respectively.
F-67