Nintendo 2016 Annual Report Download - page 8
Download and view the complete annual report
Please find page 8 of the 2016 Nintendo annual report below. You can navigate through the pages in the report by either clicking on the pages listed below, or by using the keyword search tool below to find specific information within the annual report.- 6 -
II. Business Overview
1. Overview of operating results and cash flow
(1) Operating results
During the fiscal year ended March 31, 2016, for Nintendo 3DS, Animal Crossing: Happy Home Designer and
Pokémon Super Mystery Dungeon were released globally and both became hits, selling 3.04 million and 1.22
million units, respectively. There were also multiple hit titles from third-party publishers. However, due to the
lack of major titles like Pokémon Omega Ruby/Pokémon Alpha Sapphire and Super Smash Bros. for Nintendo
3DS, which energized the entire 3DS business during the prior fiscal year, the worldwide sales of Nintendo 3DS
hardware and software were 6.79 million and 48.52 million units, respectively.
With respect to Wii U, Splatoon sold 4.27 million units and Super Mario Maker sold 3.52 million units, both
becoming blockbusters and contributing to energizing the Wii U platform. In addition, The Legend of Zelda:
Twilight Princess HD, which was released globally in March, got off to a good start. The global sales of the Wii
U hardware and software reached 3.26 million and 27.36 million units, respectively.
In addition to the above, amiibo sales continued to maintain momentum and showed strong performance globally.
The figure-type and the card-type sold approximately 24.70 million units and approximately 28.90 million units,
respectively. Furthermore, sales of additional download content for Nintendo 3DS and Wii U increased and total
download sales reached ¥43.9 billion. Moreover, our first smart device app, Miitomo, was released globally in
March and started off well.
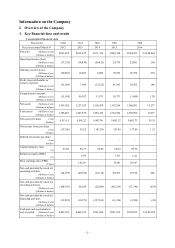
As a result, net sales were ¥504.4 billion (U.S.$4,463 million; a decrease of 8.2% on a year on year basis), of
which overseas sales were ¥368.9 billion (U.S.$ 3,264 million; a decrease of 11.0% on a year on year basis, and
73.1% of total sales). Operating income was ¥32.8 billion (U.S.$290 million; an increase of 32.7% on a year on
year basis). Mainly due to the re-evaluation of assets in foreign currencies, exchange losses by yen appreciation
totaled ¥18.3 billion (U.S.$161 million). As a result, ordinary income was ¥28.7 billion (U.S.$253 million; a
decrease of 59.2% on a year on year basis) and profit attributable to owners of parent was ¥16.5 billion
(U.S.$146 million; a decrease of 60.6% on a year on year basis).
Segment information is omitted as Nintendo operates as a single business segment.
(2) Cash flow
The ending balance of “Cash and cash equivalents” (collectively, “Cash”) as of March 31, 2016 was ¥258.0
billion (U.S.$2,283 million), with a decrease of ¥23.4 billion during the fiscal year. During the previous fiscal
year, there was a decrease of ¥59.7 billion. Net increase (decrease) of Cash and contributing factors during the
fiscal year ended March 31, 2016 are as follows:
Net cash provided by (used in) operating activities:
There were decreasing factors towards ¥27.7 billion (U.S.$245 million) of Profit before income taxes such as
payments of income taxes and various expenses. However, due to increasing factors such as decrease of
inventory and collection of trade accounts receivable and notes receivable, net cash resulted in an increase of
¥55.1 billion (U.S.$487 million) compared to an increase of ¥60.2 billion last year.
Net cash provided by (used in) investing activities:
Net cash from investing activities decreased by ¥71.7 billion (U.S.$634 million) compared to a decrease of
¥105.3 billion last year mainly due to payments into time deposits and purchase of short-term and long-term
investment securities exceeding proceeds from withdrawal of time deposits, sales of short-term and long-term
investment securities.
Net cash provided by (used in) financing activities:
There were increasing factors due to the disposal of treasury shares. However, net cash from financing activities
decreased by ¥2.9 billion (U.S.$25 million) compared to a decrease of ¥11.9 billion last year mainly due to
payments of cash dividends.
2. Risk factors
Listed below are the various risks that could significantly affect Nintendo’s operating results, share price and
financial condition. However, unpredictable risks may exist other than the risks set forth herein.
Note that matters pertaining to the future presented herein are determined by Nintendo as of the end of the fiscal
year ended March 31, 2016.

