Nintendo 2016 Annual Report Download - page 4
Download and view the complete annual report
Please find page 4 of the 2016 Nintendo annual report below. You can navigate through the pages in the report by either clicking on the pages listed below, or by using the keyword search tool below to find specific information within the annual report.-
 1
1 -
 2
2 -
 3
3 -
 4
4 -
 5
5 -
 6
6 -
 7
7 -
 8
8 -
 9
9 -
 10
10 -
 11
11 -
 12
12 -
 13
13 -
 14
14 -
 15
15 -
16
-
17
-
18
-
19
-
20
-
21
-
22
-
23
-
24
-
25
-
26
-
27
-
28
-
29
-
30
-
31
-
32
-
33
-
34
-
35
-
36
-
37
-
38
-
39
-
40
-
41
-
42
-
43
-
44
-
45
-
46
-
47
-
48
-
49
-
50
-
51
-
52
-
53
-
54
-
55
 |
 |

- 2 -
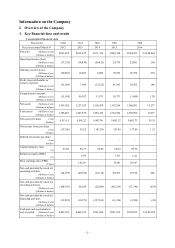
Fiscal year 72nd 73rd 74th 75th 76th
Fiscal year ended March 31 2012 2013 2014 2015 2016
Number of employees
[Separately, average number of
temporary employees] (Persons)
4,928
[803]
5,080
[753]
5,213
[717]
5,120
[667]
5,064
[633]
–
[–]
(Notes) 1. Dollar amounts are the yen equivalent, calculated, for convenience only, at a rate of ¥113 to U.S.$1, the prevailing
exchange rate on March 31, 2016.
2. Net sales do not include consumption taxes.
3. “Diluted net income per share” is not noted because the Company has not issued any dilutive shares.
4. “Return on equity” and “Price earnings ratio” for the 72nd and 74th fiscal years are not noted because the
Company recorded net losses attributable to owners of parent in those fiscal years.
5. The Company has adopted the “Revised Accounting Standard for Business Combinations” (ASBJ Statement No.
21 of September 13, 2013) and other standards, and “net income (loss)” are presented as “profit (loss) attributable
to owners of parent” from the fiscal year ended March 31, 2016, accordingly.