Nikon 2010 Annual Report Download - page 4
Download and view the complete annual report
Please find page 4 of the 2010 Nikon annual report below. You can navigate through the pages in the report by either clicking on the pages listed below, or by using the keyword search tool below to find specific information within the annual report.-
 1
1 -
 2
2 -
 3
3 -
 4
4 -
 5
5 -
 6
6 -
 7
7 -
 8
8 -
 9
9 -
 10
10 -
 11
11 -
 12
12 -
 13
13 -
 14
14 -
 15
15 -
16
-
17
-
18
-
19
-
20
-
21
-
22
-
23
-
24
-
25
-
26
-
27
-
28
-
29
-
30
-
31
-
32
-
33
-
34
-
35
-
36
-
37
-
38
-
39
-
40
-
41
-
42
-
43
-
44
-
45
-
46
-
47
-
48
-
49
-
50
-
51
-
52
-
53
-
54
-
55
-
56
-
57
-
58
-
59
-
60
-
61
-
62
 |
 |

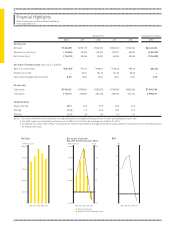
Financial Highlights
Nikon Corporation and Consolidated Subsidiaries
Years ended March 31
2
Net Sales
(Millions of yen)
2006 2007 2008 2009 2010
0
200,000
400,000
600,000
800,000
1,000,000
Net Income (Loss) and
Basic Net Income (Loss) per Share
(Millions of yen)
2006 2007 2008 2009 2010
Net Income (Loss)
Basic Net Income (Loss) per Share
-20,000
0
20,000
40,000
60,000
80,000
(Yen)
-50
0
50
100
150
200
ROE
(%)
2006 2007 2008 2009 2010
-5
0
5
10
15
20
25
Millions of Yen Thousands of U.S. Dollars
2010 2009 2008 2007 2006 2010
For the year
Net sales ¥785,499 ¥879,719 ¥955,792 ¥822,813 ¥730,944 $8,442,593
Operating income (loss) (13,854) 48,185 135,169 102,007 66,587 (148,905)
Net income (loss) (12,615) 28,056 75,484 54,825 28,945 (135,590)
Per share of common stock (yen and U.S. dollars):
Basic net income (loss) ¥(31.82) ¥70.76 ¥189.00 ¥146.36 ¥78.16 $(0.34)
Diluted net income –67.91 181.23 131.42 69.33 –
Cash dividends applicable to the year 8.00 18.00 25.00 18.00 10.00 0.09
At year-end
Total assets ¥740,632 ¥749,805 ¥820,622 ¥748,939 ¥690,920 $7,960,364
Total equity 372,070 379,087 393,126 348,445 243,122 3,999,031
Financial ratios
Equity ratio (%) 50.2 50.5 47.9 46.5 35.2
ROE (%) (3.4) 7.3 20.4 18.5 13.2
ROA (%) (1.7) 3.6 9.6 7.6 4.4
Notes: 1. Per share of common stock information is computed based on the weighted average number of shares outstanding during the year.
2. U.S. dollar fi gures are translated for reference only at ¥93.04 to U.S. $1.00, the exchange rate at March 31, 2010.
3. Throughout this annual report, ROE is calculated as net income (loss) divided by average shareholders’ equity, and ROA is calculated as net income (loss) divided
by average total assets.