Nikon 2001 Annual Report Download - page 3
Download and view the complete annual report
Please find page 3 of the 2001 Nikon annual report below. You can navigate through the pages in the report by either clicking on the pages listed below, or by using the keyword search tool below to find specific information within the annual report.-
 1
1 -
 2
2 -
 3
3 -
 4
4 -
 5
5 -
 6
6 -
 7
7 -
 8
8 -
 9
9 -
 10
10 -
 11
11 -
 12
12 -
 13
13 -
 14
14 -
15
-
16
-
17
-
18
-
19
-
20
-
21
-
22
-
23
-
24
-
25
-
26
-
27
-
28
-
29
-
30
-
31
-
32
-
33
-
34
-
35
-
36
-
37
-
38
-
39
-
40
-
41
-
42
 |
 |

97
379
,
08
9
98
372
,
14
6
99
305
,
76
5
00
371
,
80
1
N
et
Sa
l
es
N
et
I
ncome
(L
oss
)
S
h
a
r
e
h
o
l
de
r
s
’
Equit
y
01
483
,
957
97
19
,
93
6
98
8
,
31
8
(
18,233
)
00
7
,
77
0
01
2
0
,
91
1
97
165
,
77
3
98
171
,
05
1
99
160
,
99
1
00
166
,
49
5
0
1 186
,
11
9
(
Millions of Yen
)
(
Millions of Yen
)
(
Millions of Yen
)
page 1
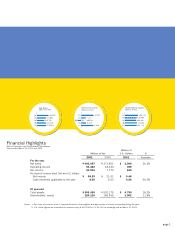
Millions of
Millions of Yen U.S. Dollars %
2001 2000 2001 Increase
For the year
Net sales ¥ 483,957 ¥371,801 $ 3,906 30.2%
Operating income 61,423 18,434 496
Net income 20,911 7,770 169
Per share of common stock (Yen and U.S. dollars):
Net income ¥ 56.53 ¥21.01 $ 0.46
Cash dividends applicable to the year 8.00 5.00 0.06 60.0%
At year-end
Total assets ¥ 593,454 ¥502,175 $ 4,790 18.2%
Shareholders’ equity 186,119 166,495 1,502 11.8%
Financial Highlights
Nikon Corporation and Consolidated Subsidiaries
Years ended March 31, 2001 and 2000
Notes: 1. Per share of common stock is computed based on the weighted average number of shares outstanding during the year.
2. U.S. dollar figures are translated for reference only at ¥123.90 to U.S. $1.00, the exchange rate at March 31, 2001.