Nikon 2001 Annual Report Download - page 15
Download and view the complete annual report
Please find page 15 of the 2001 Nikon annual report below. You can navigate through the pages in the report by either clicking on the pages listed below, or by using the keyword search tool below to find specific information within the annual report.-
 1
1 -
2
-
3
-
4
-
 5
5 -
 6
6 -
 7
7 -
 8
8 -
 9
9 -
 10
10 -
 11
11 -
 12
12 -
 13
13 -
 14
14 -
 15
15 -
 16
16 -
 17
17 -
 18
18 -
 19
19 -
 20
20 -
 21
21 -
 22
22 -
 23
23 -
 24
24 -
 25
25 -
26
-
27
-
28
-
29
-
30
-
31
-
32
-
33
-
34
-
35
-
36
-
37
-
38
-
39
-
40
-
41
-
42
 |
 |

page 13
OPERATING ENVIRONMENT
The fiscal year ended March 31, 2001 witnessed a sharp slowdown in the American economy as a tumbling stock market led to
stalled consumer spending and significant adjustments in levels of production and inventory. In Europe, solid economic growth was hit
by interest rate hikes and high oil prices, both of which put a significant damper on performance in the second half of the year.
Consistent export-led growth in Asian economies also began to show signs of tapering off as the business environment in key export
markets deteriorated.
In Japan, consumer spending continued to lack vitality. Despite a gentle recovery in the first half supported by private-sector capital
investment, the drop-off in exports in the second half had a negative impact on industrial production. Uncertainty over the prospects of
any recovery in private-sector business investment cast a dark cloud over many parts of the economy.
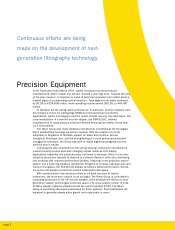
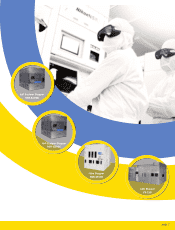
Despite harsh business conditions, the Nikon Group’s businesses performed well. Precision Equipment and Instruments benefited
from strong demand due to expansion in the semiconductor equipment market and posted solid gains. Imaging Products also produced
a good performance on the back of strong growth in the digital camera market.
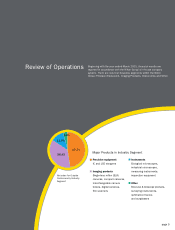
Net Sales by Industry Segment
Years ended March 31, 2001 and 2000 Thousands of
Millions of Yen, % U.S. Dollars
2001 2000 2001
Precision Equipment ¥ 234,808 ¥ 172,261 $ 1,895,139
Share of net sales 48.5% 46.3 %
Imaging Products 180,112 137,247 1,453,686
Share of net sales 37.2 36.9
Instruments 59,008 50,905 476,257
Share of net sales 12.2 13.7
Other 43,610 31,241 351,979
Share of net sales 9.0 8.4
Total ¥ 517,538 ¥ 391,654 $ 4,177,061
(Eliminations) (33,581) (19,853) (271,035)
(6.9) (5.3)
Consolidated ¥ 483,957 ¥ 371,801 $ 3,906,026
Thousands of
Millions of Yen U.S. Dollars
2001 2000 1999 1998 1997 2001
For the year
Net sales ¥ 483,957 ¥ 371,801 ¥ 305,765 ¥ 372,146 ¥379,089 $ 3,906,026
Cost of sales 301,759 247,473 205,984 224,546 219,791 2,435,499
SG&A expenses 120,775 105,894 108,522 120,123 112,385 974,782
Operating income (loss) 61,423 18,434 (8,741 ) 27,477 46,913 495,745
Income (loss) before income taxes and minority interest 29,827 11,479 (17,447 ) 18,929 36,740 240,738
Net income (loss) 20,911 7,770 (18,233 ) 8,318 19,936 168,770
Per share of common stock (Yen and U.S. dollars):
Net income (loss) ¥ 56.53 ¥ 21.01 ¥ (49.29 ) ¥ 22.48 ¥ 53.89 $ 0.46
Cash dividends applicable to the year 8.00 5.00 3.00 8.00 8.00 0.06
Capital expenditures ¥ 25,996 ¥ 13,881 ¥ 20,719 ¥ 26,168 ¥ 33,757 $ 209,815
Depreciation and amortization 16,007 17,251 20,110 18,407 15,635 129,197
R&D costs 22,794 17,798 18,729 21,633 19,681 183,972
At year-end
Total assets ¥ 593,454 ¥ 502,175 ¥ 474,965 ¥ 507,326 ¥460,271 $ 4,789,778
Shareholders' equity 186,119 166,495 160,991 171,051 165,773 1,502,171
Notes: 1. Per share of common stock is computed based on the weighted average number of shares outstanding during the year.
2. U.S. dollar figures are translated for reference only at ¥123.90 to U.S. $1.00, the exchange rate at March 31, 2001.
FIVE-YEAR SUMMARY
MANAGEMENT’S DISCUSSION AND ANALYSIS OF OPERATIONS
Nikon Corporation and Consolidated Subsidiaries
Years ended March 31