Nikon 1999 Annual Report Download - page 13
Download and view the complete annual report
Please find page 13 of the 1999 Nikon annual report below. You can navigate through the pages in the report by either clicking on the pages listed below, or by using the keyword search tool below to find specific information within the annual report.-
 1
1 -
2
-
 3
3 -
 4
4 -
 5
5 -
 6
6 -
 7
7 -
 8
8 -
 9
9 -
 10
10 -
 11
11 -
 12
12 -
 13
13 -
 14
14 -
 15
15 -
 16
16 -
 17
17 -
 18
18 -
 19
19 -
 20
20 -
 21
21 -
 22
22 -
 23
23 -
24
-
25
-
26
-
27
-
28
-
29
-
30
-
31
-
32
-
33
-
34
 |
 |

11
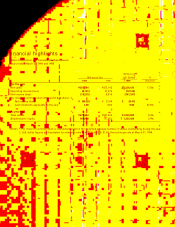
Financial Review and Analysis
At fiscal year-end, total assets amounted to ¥475.0 billion, down ¥32.4 billion, or 6.4%, from the previous fiscal year-end.
A decrease in accounts receivable caused by the drop in net sales was the main reason behind the 11.9% drop in current assets
to ¥41.7 billion. Tangible fixed assets increased by 4.3%, or ¥6.8 billion.
On the liabilities side, although borrowings increased slightly, the large drop in accounts payable helped reduce total
liabilities by ¥22.3 billion.
Dividends paid in fiscal 1999 amounted to ¥1.5 billion. Pursuant to the introduction of tax-effect accounting, Nikon made a
prior-year tax adjustment to retained earnings of ¥8.7 billion. In addition, an increase in the number of consolidated
subsidiaries added a further ¥0.9 billion to the retained surplus. However, the net effect of these two moves was more than
offset by the consolidated net loss for the year of ¥18.2 billion, which caused a net decrease in shareholders' equity of ¥10.1
billion.
Nikon Corporation and Consolidated Subsidiaries
For the years ended March 31
Thousands of
Millions of Yen U.S. Dollars
1999 1998 1997 1996 1995 1999
For the year
Net sales ¥ 305,764 ¥ 372,145 ¥ 379,089 ¥ 332,799 ¥288,485 $ 2,536,415
Cost of sales 205,984 224,545 219,791 188,726 187,344 1,708,704
SG&A expenses 108,521 120,122 112,385 94,793 82,235 900,221
Operating income (loss) (8,741) 27,476 46,912 49,279 18,905 (72,510)
Income (loss) before income taxes* (17,447) 18,929 36,740 35,317 7,714 (144,730)
Net income (loss) (18,232) 8,318 19,936 18,581 1,535 (151,247)
Per share of common stock (Yen and U.S. dollars):
Net income (loss) ¥ (49.28) ¥ 22.48 ¥ 53.89 ¥ 50.23 ¥ 4.15 $ (0.41)
Cash dividends applicable to the year 3.00 8.00 8.00 6.50 5.00 0.02
Capital expenditures ¥ 20,718 ¥ 26,168 ¥ 33,757 ¥ 17,206 ¥ 8,054 $ 171,869
Depreciation and amortization 20,110 18,407 15,635 13,715 14,708 166,819
R&D expenses 18,729 21,633 19,681 16,951 12,050 155,368
At year-end
Total assets ¥ 474,964 ¥ 507,326 ¥ 460,271 ¥ 425,083 ¥371,390 $3,939,982
Shareholders' equity 160,990 171,051 165,773 148,657 132,505 1,335,469
* Excluding minority interest
Notes: 1. Per share of common stock is computed based on the weighted average number of shares outstanding during the year.
2. U.S. dollar figures are translated for reference only at ¥120.55 to U.S. $1.00, the exchange rate at March 31, 1999.
five-year summary
1999 18.7
R&D Expenditures
(¥Billion)
1998 21.6
1997 19.7
1996 17.0
1995 12.1
1999 161.0
Shareholders' Equity
(¥Billion)
1998 171.1
1997 165.8
1996 148.7
1995 132.5
1999 (11.0)
Return on Equity (%)
1998 4.9
1997 12.7
1996 13.2
1995 1.1
QX33 .nikon second 0 0.5.12 5:35 PM ページ1 1