Nikon 1999 Annual Report Download - page 11
Download and view the complete annual report
Please find page 11 of the 1999 Nikon annual report below. You can navigate through the pages in the report by either clicking on the pages listed below, or by using the keyword search tool below to find specific information within the annual report.
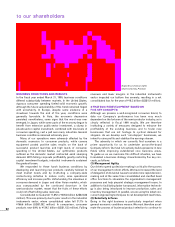
Operating Environment
In fiscal 1999, the financial year ended March 31, 1999, markets differed substantially in terms of business conditions. In the
United States, vigorous consumer spending fueled solid economic growth, although its future sustainability remains uncertain.
In Europe, despite some evidence of a slowdown towards the end of the year, conditions were generally favorable. However, in
Asia, the economic depression persisted. In Japan, while some parts of the economy began to benefit from extensive public-sec-
tor investment, a slump in private-sector capital investment, combined with flat growth in consumer spending, cast a pall over
many industries. General business conditions remained extremely poor, although some signs that the worst was over began to
emerge.
Nikon's business was badly affected by the adverse conditions in Japan. While camera equipment posted good results on the
back of successful product launches and a U.S. consumer spending boom, ophthalmic products suffered as the domestic mar-
ket contracted amid slumping demand. With falling corporate profitability greatly restricting capital investment budgets, sales of
industrial instruments plunged in the face of the ongoing recession in Japan.
09
management discussion and analysis
Net Sales by Industry Segment
For the years ended March 31, 1999, 1998 and 1997 (Millions of Yen, %)
1999 1998 1997
Consumer products ¥139,204 ¥130,266 ¥131,282
Share of net sales 45.5% 35.0% 34.6%
Industrial instruments 166,560 241,879 247,806
Share of net sales 54.5 65.0 65.4
Total ¥305,764 ¥372,145 ¥379,089
Non-Consolidated Net Sales by Sector
This breakdown is provided as an approximate indication of the share of non-consolidated net sales by sector
For the years ended March 31, 1999, 1998 and 1997 (% of Non-Consolidated Net Sales)
1999 1998 1997
Cameras 36.4% 26.8 % 23.6%
Ophthalmic products 6.6 5.6 5.5
Semiconductor manufacturing related equipment 43.3 53.5 57.6
Microscopes and measuring instruments 8.5 8.0 6.7
Surveying instruments and others 5.2 6.1 6.6
Regional Breakdown of Non-Consolidated Net Sales
This breakdown is provided for reference only.
For the years ended March 31, 1999, 1998 and 1997 (% of Non-Consolidated Net Sales)
1999 1998 1997
Domestic 38.9% 43.6% 46.7%
Export (total): 61.1 56.4 53.3
North America 24.2 22.1 15.5
Europe 14.8 14.4 15.4
Asia and Oceania 22.0 19.8 22.3
Other areas 0.1 0.1 0.1
1999 305.8
Net Sales
(¥Billion)
1998 372.1
1997 379.1
1996 332.8
1995 288.5
1999 (8.7)
Operating Income (Loss)
(¥Billion)
1998 27.5
1997 46.9
1996 49.3
1995 18.9
QX33 .nikon second 0 0.5.12 5:35 PM ページ9

