National Grid 2007 Annual Report Download - page 62
Download and view the complete annual report
Please find page 62 of the 2007 National Grid annual report below. You can navigate through the pages in the report by either clicking on the pages listed below, or by using the keyword search tool below to find specific information within the annual report.-
 1
1 -
2
-
3
-
4
-
5
-
6
-
7
-
8
-
9
-
10
-
11
-
12
-
13
-
14
-
15
-
16
-
17
-
18
-
19
-
20
-
21
-
22
-
23
-
24
-
25
-
26
-
27
-
28
-
29
-
30
-
31
-
32
-
33
-
34
-
35
-
36
-
37
-
38
-
39
-
40
-
41
-
42
-
43
-
44
-
45
-
46
-
47
-
48
-
49
-
50
-
51
-
 52
52 -
 53
53 -
 54
54 -
 55
55 -
 56
56 -
 57
57 -
 58
58 -
 59
59 -
 60
60 -
 61
61 -
 62
62 -
 63
63 -
 64
64 -
 65
65 -
 66
66 -
 67
67 -
 68
68 -
 69
69 -
 70
70 -
 71
71 -
 72
72 -
73
-
74
-
75
-
76
-
77
-
78
-
79
-
80
-
81
-
82
-
83
-
84
-
85
-
86
 |
 |

National Grid Electricity Transmission plc Annual Report and Accounts 2006/07
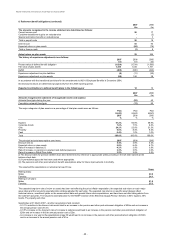
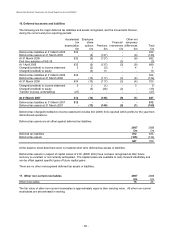
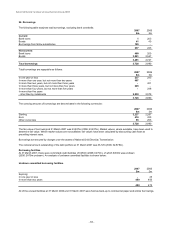
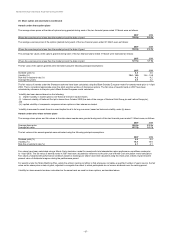
18. Derivative financial instruments (continued)
Our use of derivatives may entail a derivative transaction qualifying for one or more hedge type designations under IAS39.The fair value and their notional amounts by
designated hedge type can be analysed as follows:
2007
2006
Fair value Notional Fair value Notional Fair value Notional Fair value Notional
£m £m £m £m £m £m £m £m
Fair value hedges
Interest rate swaps 2(126) (17) (496) 24 (506) -(71)
Cross-currency interest rate swaps - - (16) (100) 12 (334) (10) (100)
2(126) (33) (596) 36 (840) (10) (171)
Cash flow hedges
Interest rate swaps 1(414) - - - - (2) (287)
Cross-currency interest rate swaps - - (2) (414) 3(80) (6) (207)
Foreign exchange forward contracts -(1) -(5) -2- -
1(415) (2) (419) 3(78) (8) (494)
Derivatives not in a formal hedge relationship
Interest rate swaps 2(186) (5) (186) -(62) (1) (117)
2(186) (5) (186) -(62) (1) (117)
5(727) (40) (1,201) 39 (980) (19) (782)
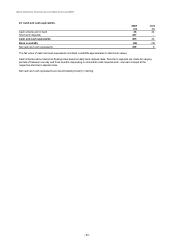
The maturity of derivative financial assets and liabilities measured at fair value can be analysed as follows:
Assets Liabilities Assets Liabilities
£m £m £m £m
In one year or less 2(4) 16 (9)
Current
2
(4)
16 (9)
In more than one year, but not more than two years 1(2) - -
In more than two years, but not more than three years - - 5(1)
In more than three years, but not more than four years -(3) - -
In more than four years, but not more than five years - - - -
In more than five years 2(31) 18 (9)
Non-current
3
(36)
23 (10)
Total
5
(40)
39 (19)
- 57 -
Asset Liability
2007 2006
Asset Liability