Napa Auto Parts 2008 Annual Report Download - page 19
Download and view the complete annual report
Please find page 19 of the 2008 Napa Auto Parts annual report below. You can navigate through the pages in the report by either clicking on the pages listed below, or by using the keyword search tool below to find specific information within the annual report.-
 1
1 -
2
-
3
-
4
-
5
-
6
-
7
-
8
-
 9
9 -
 10
10 -
 11
11 -
 12
12 -
 13
13 -
 14
14 -
 15
15 -
 16
16 -
 17
17 -
 18
18 -
 19
19 -
 20
20 -
 21
21 -
 22
22 -
 23
23 -
 24
24 -
 25
25 -
 26
26 -
 27
27 -
 28
28 -
 29
29 -
30
-
31
-
32
-
33
-
34
-
35
-
36
-
37
-
38
-
39
-
40
-
41
-
42
-
43
-
44
-
45
-
46
-
47
-
48
 |
 |
the year, from 3% to 2% to 1% in the first, second and third quarters
of 2008, respectively. is downward trend was partly due to the
impact of the decrease in miles driven caused by high gas prices over
most of the year. Demand weakened further in the fourth quarter, as
evidenced by the decrease in consumer spending, resulting in a 6%
sales decrease from the final quarter of 2007. is is consistent with
historical patterns during a softening economy, when consumers defer
or forego discretionary spending on automotive maintenance and
supply items. Other factors impacting our Automotive sales for the
year include acquisitions, which had a slightly positive effect on sales,
and the sale of our Johnson Industries business in the first quarter
of 2008, which had a negative 2% impact on sales.
Automotive sales were $5.3 billion in 2007, an increase of 2% from
2006. Our sales growth was relatively steady during the year, ranging
from 2% to 3% by quarter, as the more challenging market conditions
we began to see in the last half of 2006 continued throughout 2007
without any significant change. We observed the ongoing pressure
of high gas prices on miles driven and consumer spending, which
negatively impact aftermarket demand. e continued effectiveness
of our growth initiatives, such as our major accounts programs,
served to offset these conditions and, as a result, Automotive
reported progress in 2007.
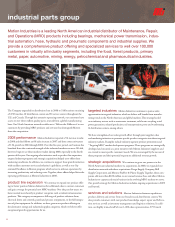
Industrial Group
Net sales for Motion Industries, our Industrial Group (“Industrial”),
were $3.5 billion in 2008, an increase of 5% compared to 2007.
rough the first three quarters of the year, sales held strong and
were relatively consistent from quarter to quarter, increasing 6% in
the first quarter and 7% in the second and third quarters. e fourth
quarter proved to be more difficult for this business, due to the
deteriorating economic environment, including worsening manu-
facturing production trends, and sales for the period were even with
the fourth quarter of 2007. In 2008, sales were positively impacted
by several acquisitions, which accounted for approximately 2% of
Industrial’s sales growth for the year.
Net sales were $3.4 billion in 2007, an increase of 8% compared
to 2006. In 2007, this group recorded strong and consistent sales
growth, with revenues increasing from 7% to 9% in each quarter of
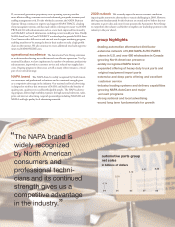
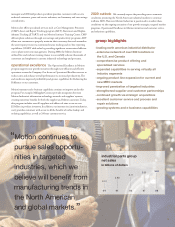
the year. Industrial participated in the continued strength of the
markets it serves through initiatives such as product line expansion,
targeted industry programs, branch expansion and acquisitions.
In addition, Industrial expanded its distribution network by
opening four new locations and by adding another eight locations
via five acquisitions.
Office Group
Net sales for S.P. Richards, our Office Products Group (“Office”),
were $1.7 billion in 2008, down 2% compared to the prior year.
2008 represents the second consecutive year of decreased revenues
for Office and is indicative of the continued industry-wide slow
down in office products consumption. During the year, sales were
down 2% in the first quarter and even with the prior year periods
in the second and third quarters. Demand in the fourth quarter
worsened, consistent with the significant increase in unemployment
for the period, and sales were down 5% from the 2007 fourth quarter.
For the year, sales were positively impacted by three acquisitions,
which contributed nearly 2% to sales in Office. e increase in net
sales due to acquisitions, as well as our sales initiatives, were more than
offset by the prevailing poor conditions in the office products industry.
Net sales for 2007 were $1.8 billion, down 1% compared to 2006.
Weak demand in the overall office products industry, which we began
to see in 2006, negatively impacted our results in 2007. Primarily,
depressed sales activity with our national accounts customer base
offset steady sales growth to independent dealers during the year.
After a 3% sales decrease in the first quarter, sales increased 1% in
the second quarter, were flat in the third quarter and decreased 1%
in the fourth quarter.
Electrical Group
Net sales for EIS, our Electrical and Electronic Group (“Electrical”),
improved to $466 million in 2008, an increase in sales of 7% for the
second consecutive year. Electrical sales were strong through the first
nine months of the year, increasing 7% in the first quarter, 11% in
the second quarter and 13% in the third quarter. e deteriorating
economy, including manufacturing contraction as measured by the
Institute for Supply Management’s Purchasing Managers Index, as
well as decreasing commodity prices in a major product category,
had a significant impact on this business in the fourth quarter and
sales decreased 4% from the same period in 2007. Acquisitions during
the year had a positive 2% impact on Electrical sales in 2008 and,
combined with Electrical’s sales initiatives, partially offset the weak-
ening conditions in the marketplace in the last quarter of the year.
Net sales increased by 7% to $436 million in 2007. e sales progress
at Electrical reflected favorable market conditions, as evidenced
by continued manufacturing expansion in the U.S during the year.
Also, this group’s focus on new products and markets, geographic
expansion and strategic customer and supplier relationships served
as key sales initiatives at Electrical. During 2007, sales were up 12%
in the first quarter, 7% in the second quarter, 4% in the third quarter
and 6% in the fourth quarter.
Cost of Goods Sold
Cost of goods sold was $7.7 billion, $7.6 billion and $7.4 billion in
2008, 2007 and 2006, respectively, and represents 70.3% of net sales
in all three years. e constant rate over these three periods reflects
how our ongoing gross margin initiatives to enhance our pricing
strategies, promote and sell higher margin products and minimize
material acquisition costs were offset by increasing competitive
pricing pressures in the markets we serve.
17