Napa Auto Parts 2003 Annual Report Download - page 15
Download and view the complete annual report
Please find page 15 of the 2003 Napa Auto Parts annual report below. You can navigate through the pages in the report by either clicking on the pages listed below, or by using the keyword search tool below to find specific information within the annual report.-
 1
1 -
2
-
3
-
4
-
 5
5 -
 6
6 -
 7
7 -
 8
8 -
 9
9 -
 10
10 -
 11
11 -
 12
12 -
 13
13 -
 14
14 -
 15
15 -
 16
16 -
 17
17 -
 18
18 -
 19
19 -
 20
20 -
 21
21 -
 22
22 -
 23
23 -
 24
24 -
 25
25 -
26
-
27
-
28
-
29
-
30
-
31
-
32
-
33
-
34
-
35
-
36
-
37
-
38
-
39
-
40
 |
 |

13
OVERVIEW
Genuine Parts Company is a service organization engaged in
the distribution of automotive replacement parts, industrial
replacement parts, office products and electrical/electronic
materials. The Company has a long tradition of growth
dating back to 1928, the year we were founded in Atlanta,
Georgia. In 2003, business was conducted throughout the
United States, in Canada and in Mexico from approximately
1,800 locations. We recorded consolidated net income, before
the cumulative effect of changes in accounting principles, of
$354 million compared to $368 million in 2002, a decrease of
4%. After the 2003 and 2002 cumulative effect of changes in
accounting principles, net income was $334 million, as com-
pared to the net loss in 2002 of $28 million. The results in all
of our industry groups for each of the last three years have
been affected by the slow economy with the impact being
greatest for Motion Industries and EIS due to the conditions
in the manufacturing sectors of the economy. The Company
has countered this impact with the introduction of new
product lines, sales to new markets and cost savings initia-
tives, among other things. During 2001, we recorded charges
associated with plant closings, exiting certain business lines
and determinations of impairment of certain assets. In addi-
tion, during 2002 and 2003 we recorded certain charges to
earnings as a result of changes in accounting principles relating
to goodwill impairment and cash consideration received from
vendors. These changes have no impact on our operating
results and no cash implications for us. The 2001 charges and
changes in accounting principles during the prior three year
period are discussed further under “Results of Operations”
and “Facility Consolidation, Impairment And Other Charges.”
Our results are also dependent on the effect of certain
accounting assumptions and estimates which are discussed
under “Critical Accounting Estimates” below. The major
December 31, 2003 balance sheet categories were relatively
consistent with the December 31, 2002 balance sheet, and our
liquidity and capital resources improved as we reduced our
total debt outstanding at December 31, 2003 by approximately
$114 million compared to December 31, 2002.
RESULTS OF OPERATIONS
The Company’s results of operations are summarized below
for the three years ended December 31, 2003, 2002 and 2001.
NET SALES
Net sales for the year ended December 31, 2003, totaled
$8.45 billion, a 2% increase from 2002. All industry groups
were affected to some degree by competitive pressures asso-
ciated with the difficult economic climate in our markets for
most of the year. The impact of these conditions was the
greatest for the Industrial and Electrical Groups due to our
dependence on the manufacturing sectors of the economy in
these segments. Prices were down slightly in the Automotive
and Electrical segments in 2003, while pricing in the Industrial
and Office segments increased 2% and .6%, respectively,
during 2003. Net sales for the year ended December 31, 2002,
totaled $8.26 billion, which was a slight increase from 2001.
The economy was challenging for us in 2002, so it was signifi-
cant for the Company to achieve at least some sales growth.
In 2002, prices were down slightly in the Automotive and
Electrical segments, while pricing in the Industrial and Office
segments increased 2% and .7%, respectively.
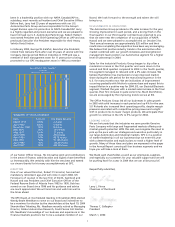
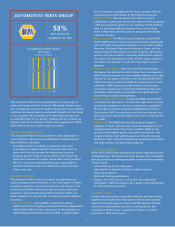
Automotive Group
Sales for the Automotive Group (“Automotive”) were $4.5
billion in 2003, an increase of 3% over 2002. Automotive sales
were $4.3 billion in 2002, an increase of 2% over 2001.
Automotive revenues have been relatively consistent in the
past three years, up 2% in 2001 and with comparative quarterly
increases each quarter in 2002 and 2003. In the 4th quarter
of 2003, Automotive sales were stronger than the previous
quarters in 2003, up 6%.
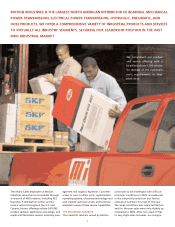
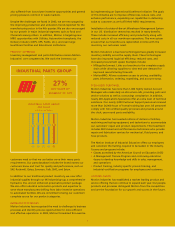
Industrial Group
Sales for Motion Industries, our Industrial Group (“Industrial”),
were $2.3 billion in 2003, a slight increase over the previous
year. Industrial sales were $2.2 billion in 2002, a slight increase
over 2001. As noted above, the weak conditions in the markets
served by Industrial have affected our sales growth in this
segment over the last three years. Fortunately, industrial
production and factory utilization numbers used to measure
these markets are beginning to show some improving trends.
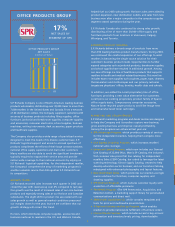
Office Group
Sales for S.P. Richards, our Office Products Group (“Office”),
were $1.5 billion, up 4% over 2002. Our Office sales were
$1.4 billion in 2002, up 1% over 2001. Office has continued
to expand their product offerings to generate sales growth.
In addition, strong sales of computer supplies and accessories
supported their growth in 2003.
Electrical Group
Sales for EIS, our Electrical and Electronic Group (“Electrical”),
were down 6% to $298 million in 2003. Our Electrical sales
were down 19% to $316 million in 2002. As noted above, the
decrease in sales in the Electrical Group can be generally attrib-
uted to the Group’s dependence on the manufacturing sector of
the economy. In addition, conditions in the telecommunications
industry have resulted in weaker sales in recent years. The sales
trends in 2003 reflected an improving trend for Electrical, and
sales in the 4th quarter were slightly greater than in 2002.
COST OF GOODS SOLD/EXPENSES
Cost of goods sold in 2003 was 69.0% of net sales compared to
69.1% in 2002. Selling, administrative, and other expenses of
MANAGEMENT’S DISCUSSION AND ANALYSIS OF FINANCIAL CONDITION AND RESULTS OF OPERATIONS
December 31, 2003
2003 2002 2001
Year ended December 31 (in thousands except for per share data)
Net Sales $8,449,300 $8,258,927 $ 8,220,668
Gross Profit 2,622,616 2,554,178 2,521,494
Income before
Cumulative Effect of a
Change in Accounting
Principle 353,642 367,500 297,147
Cumulative Effect of a
Change in Accounting
Principle (19,541) (395,090) —
Net Income (Loss) 334,101 (27,590) 297,147
Diluted Earnings (Loss)
per share:
Before Change in
Accounting Principle 2.03 2.10 1.71
After Change in
Accounting Principle 1.91 (.16) 1.71