NEC 2009 Annual Report Download - page 3
Download and view the complete annual report
Please find page 3 of the 2009 NEC annual report below. You can navigate through the pages in the report by either clicking on the pages listed below, or by using the keyword search tool below to find specific information within the annual report.-
 1
1 -
 2
2 -
 3
3 -
 4
4 -
 5
5 -
 6
6 -
 7
7 -
 8
8 -
 9
9 -
 10
10 -
 11
11 -
 12
12 -
 13
13 -
 14
14 -
15
-
16
-
17
-
18
-
19
-
20
-
21
-
22
-
23
-
24
-
25
-
26
-
27
-
28
-
29
-
30
-
31
-
32
-
33
-
34
-
35
-
36
-
37
-
38
-
39
-
40
-
41
-
42
-
43
-
44
-
45
-
46
-
47
-
48
-
49
-
50
-
51
-
52
-
53
-
54
-
55
-
56
-
57
-
58
-
59
-
60
-
61
-
62
-
63
-
64
-
65
-
66
-
67
-
68
-
69
-
70
-
71
-
72
-
73
-
74
-
75
-
76
-
77
-
78
-
79
-
80
-
81
-
82
-
83
-
84
-
85
-
86
-
87
-
88
-
89
-
90
-
91
-
92
-
93
-
94
-
95
-
96
-
97
-
98
-
99
-
100
-
101
-
102
-
103
-
104
-
105
-
106
-
107
-
108
-
109
-
110
-
111
-
112
-
113
-
114
-
115
-
116
-
117
-
118
-
119
-
120
-
121
-
122
-
123
-
124
-
125
-
126
-
127
-
128
-
129
-
130
 |
 |

07 08 09–50
0
50
100
150
200
–1.0
0.0
1.0
2.0
3.0
4.0
07 08 09–300
0
10
20
30
07 08 090
500
1,000
1,500
1,000
0
2,000
3,000
4,000
5,000
07 08 09
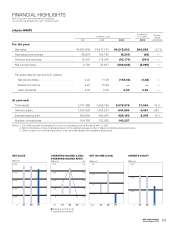
NET SALES
(Billion ¥)
OPERATING INCOME (LOSS),
OPERATING INCOME RATIO
(Billion ¥) (%)
NET INCOME (LOSS)
(Billion ¥)
OWNER’S EQUITY
(Billion ¥)
FINANCIAL HIGHLIGHTS
NEC Corporation and Consolidated Subsidiaries
For the years ended March 31, 2007, 2008 and 2009
(Japan GAAP)
In millions of yen
In millions of
U.S. dollars Percent
change
2009/20082007 2008 2009 2009
For the year:
Net sales . . . . . . . . . . . . . . . . . . . . . . . . . . . . . . ¥4,652,649 ¥4,617,153 ¥4,215,603 $42,582 –8.7%
Operating income (loss) . . . . . . . . . . . . . . . . . . . 69,976 156,765 (6,201) (63) —
Ordinary income (loss) . . . . . . . . . . . . . . . . . . . . 16,347 112,240 (93,171) (941) —
Net income (loss) . . . . . . . . . . . . . . . . . . . . . . . . 9,128 22,681 (296,646) (2,996) —
Per share data (in yen and U.S. dollars):
Net income (loss) . . . . . . . . . . . . . . . . . . . . . . 4.43 11.06 (146.64) (1.48) —
Diluted net income . . . . . . . . . . . . . . . . . . . . . 4.23 10.64 — — —
Cash dividends . . . . . . . . . . . . . . . . . . . . . . . 8.00 8.00 0.00 0.00 —
At year-end:
Total assets . . . . . . . . . . . . . . . . . . . . . . . . . . . . 3,731,669 3,526,795 3,075,378 31,064 –12.8
Owner’s equity . . . . . . . . . . . . . . . . . . . . . . . . . 1,038,808 1,004,221 641,654 6,481 –36.1
Interest-bearing debt . . . . . . . . . . . . . . . . . . . . . 859,292 800,843 925,163 9,345 15.5
Number of employees . . . . . . . . . . . . . . . . . . . 154,786 152,922 143,327
Notes: 1. U.S. dollar amounts are translated from yen, for convenience only, at the rate of ¥99 = U.S.$1.
2. Net income (loss) per share is calculated based on the weighted-average number of shares outstanding during each period.
3. Owner’s equity is sum of total shareholders’ equity and total valuation and translation adjustments.
Operating Income (Loss)
Operating Income Ratio
01
NEC CORPORATION
Annual Report 2009