Mitsubishi 2003 Annual Report Download - page 3
Download and view the complete annual report
Please find page 3 of the 2003 Mitsubishi annual report below. You can navigate through the pages in the report by either clicking on the pages listed below, or by using the keyword search tool below to find specific information within the annual report.-
 1
1 -
 2
2 -
 3
3 -
 4
4 -
 5
5 -
 6
6 -
 7
7 -
 8
8 -
 9
9 -
 10
10 -
 11
11 -
 12
12 -
 13
13 -
 14
14 -
15
-
16
-
17
-
18
-
19
-
20
-
21
-
22
-
23
-
24
-
25
-
26
-
27
-
28
-
29
-
30
-
31
-
32
-
33
-
34
-
35
-
36
-
37
-
38
-
39
-
40
-
41
-
42
-
43
-
44
-
45
-
46
-
47
-
48
-
49
-
50
-
51
-
52
-
53
-
54
-
55
-
56
-
57
-
58
-
59
-
60
-
61
-
62
-
63
-
64
-
65
-
66
-
67
-
68
-
69
-
70
-
71
-
72
-
73
-
74
-
75
-
76
-
77
-
78
 |
 |

1MITSUBISHI MOTORS CORPORATION
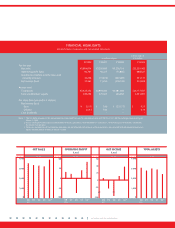
FINANCIAL HIGHLIGHTS
Mitsubishi Motors Corporation and Consolidated Subsidiaries
In thousands of
In millions of yen U.S. dollars
FY2002 FY2001 FY2000 FY2002
For the year:
Net sales ¥3,884,874 ¥3,200,699 ¥3,276,716 $32,320,083
Operating profit (loss) 82,761 40,227 (73,865) 688,527
Income (loss) before income taxes and
minority interests 42,206 (31,875) (407,289) 351,131
Net income (loss) 37,361 11,256 (278,139) 310,824
At year–end:
Total assets ¥2,425,352 ¥2,894,560 ¥2,981,668 $20,177,637
Total stockholders’ equity 280,294 270,663 256,068 2,331,897
Per share data (yen and U.S. dollars):
Net income (loss):
Basic ¥ 25.35 ¥ 7.66 ¥ (232.77) $ 0.21
Diluted 23.43 7.42 – 0.19
Cash dividends – – – –
Note: 1. The U.S. dollar amounts in this annual report are transrated from yen, for convenience only, at ¥120.20 = U.S.$1.00, the exchange rate prevailing on
March 31, 2003.
2. Due to a change of balance date at consolidated overseas subsidiaries, from December 31 to March 31, 15-month figures for overseas subsidiaries
have been incorporated.
3. The assets and liabilities of truck and bus operations are not reflected each account as these operations were spun off and subsequently became an
equity-method affiliate of MMC on March 14, 2003.
100
50
–50
–100
0
60
0
20
40
–300
–20
98
(FY)
99 00 01 022) 022) 022) 023)
98
(FY)
99 00 01 98
(FY)
99 00 01 98
(FY)
99 00 01
NET SALES
(¥ billion)
OPERATING PROFIT
(Loss)
(¥ billion)
NET INCOME
(Loss)
(¥ billion)
TOTAL ASSETS
(¥ billion)
4,000
3,000
2,000
1,000
0
4,000
3,000
2,000
1,000
0