Mercury Insurance 2013 Annual Report Download - page 10
Download and view the complete annual report
Please find page 10 of the 2013 Mercury Insurance annual report below. You can navigate through the pages in the report by either clicking on the pages listed below, or by using the keyword search tool below to find specific information within the annual report.-
 1
1 -
 2
2 -
 3
3 -
 4
4 -
 5
5 -
 6
6 -
 7
7 -
 8
8 -
 9
9 -
 10
10 -
 11
11 -
 12
12 -
 13
13 -
 14
14 -
 15
15 -
 16
16 -
 17
17 -
 18
18 -
 19
19 -
 20
20 -
 21
21 -
22
-
23
-
24
-
25
-
26
-
27
-
28
-
29
-
30
-
31
-
32
-
33
-
34
-
35
-
36
-
37
-
38
-
39
-
40
-
41
-
42
-
43
-
44
-
45
-
46
-
47
-
48
-
49
-
50
-
51
-
52
-
53
-
54
-
55
-
56
-
57
-
58
-
59
-
60
-
61
-
62
-
63
-
64
-
65
-
66
-
67
-
68
-
69
-
70
-
71
-
72
-
73
-
74
-
75
-
76
-
77
-
78
-
79
-
80
-
81
-
82
-
83
-
84
-
85
-
86
-
87
-
88
-
89
-
90
-
91
-
92
-
93
-
94
-
95
-
96
-
97
-
98
-
99
-
100
-
101
-
102
-
103
-
104
-
105
-
106
-
107
-
108
-
109
-
110
-
111
 |
 |

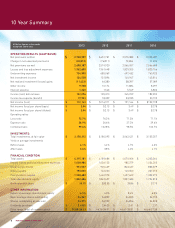
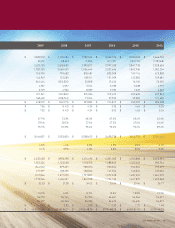
10 Year Summary
All dollar figures in thousands,
except per share data 2013 2012 2011 2010
OPERATING RESULTS (GAAP BASIS):
Net premiums written $ 2,728,999 $ 2,651,731 $ 2,575,383 $ 2,555,481
Change in net unearned premiums (30,812) (76,811) (9,326) 11,204
Net premiums earned 2,698,187 2,574,920 2,566,057 2,566,685
Losses and loss adjustment expenses 1,962,690 1,961,448 1,829,205 1,825,766
Underwriting expenses 724,995 685,069 697,432 760,923
Net investment income 124,538 131,896 140,947 143,814
Net realized investment (losses) gains (11,422) 66,380 58,397 57,089
Other income 9,738 10,174 11,884 8,297
Interest expense 1,260 1,543 5,549 6,806
Income (loss) before taxes 132,096 135,310 245,099 182,390
Income tax expense (benefit) 19,953 18,399 53,935 30,192
Net income (loss) $ 112,143 $ $116,911 $ 191,164 $ $152,198
Net income (loss) per share (basic) $ 2.04 $ $2.13 $ 3.49 $ $2.78
Net income (loss) per share (diluted) $ 2.04 $ $2.13 $ 3.49 $ $2.78
Operating ratios
Loss ratio 72.7% 76.2% 71.3% 71.1%
Expense ratio 26.9% 26.6% 27.2% 29.6%
Combined ratio 99.6% 102.8% 98.5% 100.7%
INVESTMENTS:
Total investments, at fair value $ 3,158,312 $ 3,180,095 $ 3,062,421 $ 3,155,257
Yield on average investments
Before taxes 4.1% 4.4% 4.7% 4.6%
After taxes 3.6% 3.8% 4.2% 4.1%
FINANCIAL CONDITION:
Total assets $ 4,315,181 $ 4,189,686 $ 4,070,006 $ 4,203,364
Unpaid losses and loss adjustment expenses 1,038,984 1,036,123 985,279 1,034,205
Unearned premiums 953,527 920,429 843,427 833,379
Notes payable 190,000 140,000 140,000 267,210
Policyholders’ surplus 1,528,682 1,440,973 1,497,609 1,322,270
Total shareholders’ equity 1,822,486 1,842,497 1,857,483 1,794,815
Book value per share $ 33.15 $ $33.55 $ 33.86 $ 32.75
OTHER INFORMATION:
Return on average shareholders’ equity 6.5% 4.0% 8.4% 6.5%
Basic average shares outstanding 54,947 54,899 54,825 54,792
Shares outstanding at year-end 54,975 54,922 54,856 54,803
Dividends per share $ 2.4525 $ 2.4425 $ 2.41 $ 2.37
Price range (bids) of common stock $ 51.00-36.03 $ 46.76-36.01 $ 46.61-33.81 $ 46.66-37.38
10 Year Summary
8
MERCURY GENERAL CORPORATION