Mercedes 2001 Annual Report Download - page 3
Download and view the complete annual report
Please find page 3 of the 2001 Mercedes annual report below. You can navigate through the pages in the report by either clicking on the pages listed below, or by using the keyword search tool below to find specific information within the annual report.-
 1
1 -
 2
2 -
 3
3 -
 4
4 -
 5
5 -
 6
6 -
 7
7 -
 8
8 -
 9
9 -
 10
10 -
 11
11 -
 12
12 -
 13
13 -
 14
14 -
15
-
16
-
17
-
18
-
19
-
20
-
21
-
22
-
23
-
24
-
25
-
26
-
27
-
28
-
29
-
30
-
31
-
32
-
33
-
34
-
35
-
36
-
37
-
38
-
39
-
40
-
41
-
42
-
43
-
44
-
45
-
46
-
47
-
48
-
49
-
50
-
51
-
52
-
53
-
54
-
55
-
56
-
57
-
58
-
59
-
60
-
61
-
62
-
63
-
64
-
65
-
66
-
67
-
68
-
69
-
70
-
71
-
72
-
73
-
74
-
75
-
76
-
77
-
78
-
79
-
80
-
81
-
82
-
83
-
84
-
85
-
86
-
87
-
88
-
89
-
90
-
91
-
92
-
93
-
94
-
95
-
96
-
97
-
98
-
99
-
100
-
101
-
102
-
103
-
104
-
105
-
106
-
107
-
108
-
109
-
110
-
111
-
112
-
113
-
114
-
115
-
116
-
117
-
118
-
119
-
120
-
121
-
122
-
123
-
124
-
125
-
126
-
127
-
128
-
129
-
130
 |
 |

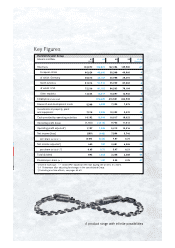
Mercedes-Benz Passenger Cars & smart
Operating profit
Operating profit adjusted
Revenues
Investments in property, plant and equipment
Research and development
Unit sales
Employees (Dec. 31)
2,145
2,874
43,700
2,096
2,241
1,154,861
100,893
2,951
2,961
47,705
2,061
2,402
1,229,688
102,223
2,627
2,636
42,462
1,834
2,138
01
€
01
US $
%
change
+38
+3
+9
-2
+7
+6
+1
00
€
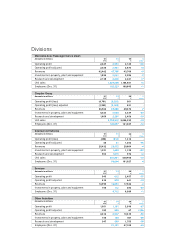
Divisions
Chrysler Group
Operating profit (loss)
Operating profit (loss) adjusted
Revenues
Investments in property, plant and equipment
Research and development
Unit sales
Employees (Dec. 31)
501
531
68,372
6,339
2,456
3,045,233
121,027
(5,281)
(2,183)
63,483
5,083
2,201
2,755,919
104,057
(4,701)
(1,943)
56,506
4,524
1,959
01
€
01
US $
%
change
.
.
-7
-20
-10
-10
-14
00
€
Commercial Vehicles
Operating profit (loss)
Operating profit adjusted
Revenues
Investments in property, plant and equipment
Research and development
Unit sales
Employees (Dec. 31)
1,212
1,253
29,804
1,128
974
548,955
101,027
(514)
51
28,572
1,484
1,015
492,851
96,644
(458)
45
25,432
1,321
903
01
€
01
US $
%
change
.
-96
-4
+32
+4
-10
-4
00
€
Services
Operating profit
Operating profit adjusted
Revenues
Investments in property, plant and equipment
Employees (Dec. 31)
2,457
641
17,526
282
9,589
612
578
16,851
112
9,712
545
514
14,999
100
01
€
01
US $
%
change
-75
-10
-4
-60
+1
00
€
Other Activities
Operating profit
Operating profit adjusted
Revenues
Investments in property, plant and equipment
Research and development
Employees (Dec. 31)
3,590
67
10,615
547
1,753
47,108
1,181
205
4,507
168
390
21,101
1,051
182
4,012
150
347
01
€
01
US $
%
change
-67
+206
-58
-69
-78
-55
00
€
Amounts in millions
Amounts in millions
Amounts in millions
Amounts in millions
Amounts in millions