Marks and Spencer 2005 Annual Report Download - page 10
Download and view the complete annual report
Please find page 10 of the 2005 Marks and Spencer annual report below. You can navigate through the pages in the report by either clicking on the pages listed below, or by using the keyword search tool below to find specific information within the annual report.-
 1
1 -
 2
2 -
 3
3 -
 4
4 -
 5
5 -
 6
6 -
 7
7 -
 8
8 -
 9
9 -
 10
10 -
 11
11 -
 12
12 -
 13
13 -
 14
14 -
 15
15 -
 16
16 -
 17
17 -
 18
18 -
 19
19 -
 20
20 -
 21
21 -
22
-
23
-
24
-
25
-
26
-
27
-
28
-
29
-
30
-
31
-
32
-
33
-
34
-
35
-
36
-
37
-
38
-
39
-
40
-
41
-
42
-
43
-
44
-
45
-
46
-
47
-
48
-
49
-
50
-
51
-
52
-
53
-
54
-
55
-
56
-
57
-
58
-
59
-
60
-
61
-
62
-
63
-
64
 |
 |

8MARKS AND SPENCER GROUP PLC
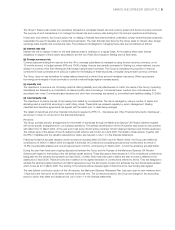
Financial review continued
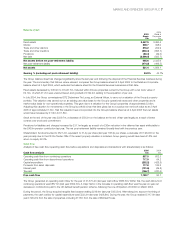
The total movements in net debt comprise the amounts shown in the table below:
2005 2004
Cash flow analysis £m £m
Opening net debt (1,994.7) (1,831.4)
Free cash flow 1,192.7 93.7
Equity dividends (236.9) (247.1)
Net sale of fixed asset investments 0.8 8.7
Acquisition of per una (125.9) –
Sale of Financial Services 1,316.7 –
Closure of Continental European operations 12.7 51.3
Issue of new shares under employee share schemes 68.4 24.8
Purchase of own shares (2,300.0) (54.4)
Tender Offer expenses (14.9) –
Net sale/(purchase) of own shares held by employee trusts 0.6 (3.6)
Redemption of B shares (19.2) (33.4)
Exchange movement 0.7 (3.3)
Closing net debt (2,099.0) (1,994.7)
2005 2004
Analysed between: £m £m
Continuing operations (2,099.0) (823.7)
Discontinued operations –(1,171.0)
Closing net debt (2,099.0) (1,994.7)
Transactions with shareholders (dividends paid, Tender Offer, redemption of B shares and the issue of new shares under employee share
schemes) resulted in a net cash outflow of £2,502.6m (last year £310.1m).
At the end of the period, net debt was £2,099.0m, an increase of £104.3m, giving rise to retail gearing of 84.5% (last year 44.7%)
including the net post-retirement liability.
Financing and capital structure
In August 2004, we signed two new banking facilities totalling £2bn, being a £1.2bn five-year term facility and an £800m bridging loan
pending completion of the sale of Financial Services. Part utilisation of these facilities, together with existing resources and the resultant
proceeds from the sale of Financial Services, were used to fund the return of £2.3bn to shareholders.
We currently have committed facilities of £1,260m available together with uncommitted bank facilities of £190m supporting our £1.5bn
Commercial Paper programme.
Average interest rates on borrowings were higher during the year at 5.7% (last year 5.3%). Interest cover was 8.2 times and fixed charge
cover was 4.1 times.
On 28 October, we purchased 635,359,116 ordinary shares, representing 27.9% of the issued share capital, for cancellation at a price of
362p per share and a total cost of £2.3bn.
On 27 September 2004 and 29 March 2005, 16,454,305 and 10,967,542 B shares respectively, were redeemed at par, at a total cost of
£19.2m. Following this redemption, 93,822,916 B shares remain in issue. The next opportunity for redemption will be on 26 September 2005.
Treasury policy and financial risk management
The Board approves treasury policies and senior management directly control day-to-day operations. The Board delegates certain
responsibilities to the treasury committee, comprising one executive director, one non-executive director, the Director of Corporate
Finance, the Group Treasurer and the Director, Financial Services. The treasury committee is empowered to take decisions, as necessary,
within that delegated authority.
The Group’s financial instruments, other than derivatives, comprise borrowings, cash and liquid resources and various items, such as trade
debtors and trade creditors, that arise directly from its operations. The main purpose of these financial instruments is to raise finance for
the Group’s operations.