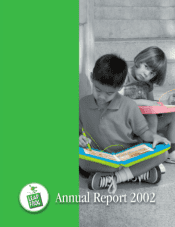
LeapFrog 2002 Annual Report Download - page 8
Download and view the complete annual report
Please find page 8 of the 2002 LeapFrog annual report below. You can navigate through the pages in the report by either clicking on the pages listed below, or by using the keyword search tool below to find specific information within the annual report.-
 1
1 -
 2
2 -
 3
3 -
 4
4 -
 5
5 -
 6
6 -
 7
7 -
 8
8 -
 9
9 -
 10
10 -
 11
11 -
 12
12 -
 13
13 -
 14
14 -
 15
15 -
 16
16 -
 17
17 -
 18
18 -
 19
19 -
20
-
21
-
22
-
23
-
24
-
25
-
26
-
27
-
28
-
29
-
30
-
31
-
32
-
33
-
34
-
35
-
36
-
37
-
38
-
39
-
40
-
41
-
42
-
43
-
44
-
45
-
46
-
47
-
48
-
49
-
50
-
51
-
52
-
53
-
54
-
55
-
56
-
57
-
58
-
59
-
60
-
61
-
62
-
63
-
64
-
65
-
66
-
67
-
68
-
69
-
70
-
71
-
72
-
73
-
74
-
75
-
76
-
77
-
78
-
79
-
80
-
81
-
82
-
83
-
84
-
85
-
86
-
87
-
88
-
89
-
90
-
91
-
92
-
93
-
94
-
95
-
96
-
97
-
98
-
99
-
100
-
101
-
102
-
103
-
104
 |
 |
in the U.S. industry for supplemental educational materials, which has experienced significant growth, according
to a report for the period from 1998 to 2001 by Simba Information, Inc., a provider of market information for the
education industry.
We believe two major trends are driving increased spending on educational products and redefining our
markets. First, both parents and teachers, across the United States and globally, are becoming increasingly
concerned about the reading, writing and math skills of young children. This concern is influenced by a number
of factors, including the state of education across the United States and the growing pressures for children to
excel in an increasingly knowledge-based society. Second, technological advances are creating new avenues for
delivering educational content, measuring academic performance and making the learning process more effective
and more accessible. We believe that these trends, along with the resulting benefit from increased requirements
for better assessment of student performance and increased accountability of educators and school systems
provide us with a significant market opportunity.
The increasing importance of education is further demonstrated by the “No Child Left Behind Act of 2001,”
signed into law in January 2002. This Act is the most sweeping reform of the Elementary and Secondary
Education Act, or ESEA, since ESEA was enacted in 1965. Under this new law, funding under ESEA increased
by more than 49% from 2000 to 2002, with the federal government providing over $22.0 billion in funds for the
2002 through 2003 school year. The Act is based on four basic principles: stronger accountability for results,
increased flexibility and local control, expanded options for parents and an emphasis on teaching methods that
have been proven to work.
The Consumer Market
According to NPD, the U.S. toy industry had aggregate retail sales in 2002 of $20.3 billion. References to
the toy industry do not include the video game market. Within the U.S. toy industry, we compete primarily in the
infant and toddler category, the preschool category and electronic learning aids category, which had combined
sales of approximately $2.9 billion in 2002, according to NPD. Preschool electronic learning aids is a sub-
segment of the preschool category, covering children ages 3 to 5, and grew to $520 million in 2002, according to
NPD. In 2002, our market share of the overall preschool category was approximately 20% and our market share
of the pre-school electronic learning aids sub-segment was approximately 75%. We believe increased sales of our
products have played a significant part in the growth of the preschool category, and the preschool electronic
learning aids sub-segment from 2000 to 2002. Additionally, we compete in the non-preschool electronic learning
aids category, covering children ages 6 to 12, which had sales of $144.4 million in 2002, according to NPD.
Worldwide toy sales were $54.7 billion in 2000, with 56% outside of North America, as reported by NPD
Worldwide. Many toys and games introduced in the United States also appeal to foreign consumers. Most major
U.S. toy companies define their market as global and sell products in Canada, Europe, Central and South
America, and the Pacific Rim countries. We expect our international net sales, which totaled approximately $54
million in 2002, to grow significantly in the future.
The School Market
The supplemental educational materials category encompasses all educational materials other than the basic
textbooks a teacher uses in the classroom and is one of the fastest growing categories of the K-12 educational
industry in the United States, according to Simba. Simba estimates that annual sales of supplemental educational
materials to schools in the United States were approximately $3.4 billion in 2001 up from $2.2 billion in 1998.
The instructional software market, a sub-segment of the overall supplemental educational materials category, is a
key area of focus for us. According to Simba, this sub-segment is the fastest growing market of the entire K-12
supplemental educational materials category, with estimated sales of approximately $1.3 billion in 2001 up from
$0.6 billion in 1998. Based on information from the U.S. Department of Education and a 2001 study from The
National School Supply and Equipment Association, we estimate that the 3.3 million teachers in the United
States each spend annually, on average, $589 of their own money on supplies to supplement classroom materials.
3