Kodak 2002 Annual Report Download - page 78
Download and view the complete annual report
Please find page 78 of the 2002 Kodak annual report below. You can navigate through the pages in the report by either clicking on the pages listed below, or by using the keyword search tool below to find specific information within the annual report.-
 1
1 -
2
-
3
-
4
-
5
-
6
-
7
-
8
-
9
-
10
-
11
-
12
-
13
-
14
-
15
-
16
-
17
-
18
-
19
-
20
-
21
-
22
-
23
-
24
-
25
-
26
-
27
-
28
-
29
-
30
-
31
-
32
-
33
-
34
-
35
-
36
-
37
-
38
-
39
-
40
-
41
-
42
-
43
-
44
-
45
-
46
-
47
-
48
-
49
-
50
-
51
-
52
-
53
-
54
-
55
-
56
-
57
-
58
-
59
-
60
-
61
-
62
-
63
-
64
-
65
-
66
-
67
-
 68
68 -
 69
69 -
 70
70 -
 71
71 -
 72
72 -
 73
73 -
 74
74 -
 75
75 -
 76
76 -
 77
77 -
 78
78 -
 79
79 -
 80
80 -
 81
81 -
 82
82 -
 83
83 -
 84
84 -
 85
85 -
 86
86 -
 87
87 -
 88
88 -
89
-
90
-
91
-
92
-
93
-
94
-
95
-
96
-
97
-
98
-
99
-
100
-
101
-
102
-
103
-
104
-
105
-
106
-
107
-
108
-
109
-
110
-
111
-
112
-
113
-
114
-
115
-
116
-
117
-
118
-
119
-
120
-
121
-
122
-
123
-
124
 |
 |

Financials
78
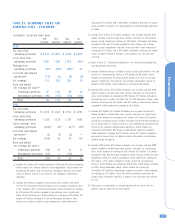
Eastman Kodak Company and Subsidiary Companies
Summary of Operating Data
(Dollar amounts and shares in millions, except per share data)
2002 2001 2000 1999 1998
Net sales from continuing operations $12,835 $ 13,229 $ 13,994 $ 14,089 $ 13,406
Earnings from continuing operations before interest,
other (charges) income, and income taxes 1,220 352 2,214 1,990 1,888
Earnings (loss) from
Continuing operations 793 (1) 81(2) 1,407(3) 1,392(4) 1,390(5)
Discontinued operations (23)(6) (5)(6) ———
Net earnings 770 76 1,407 1,392 1,390
Earnings and Dividends
Net earnings
—% of sales 6.0% 0.6% 10.1% 9.9% 10.4%
—% return on average shareholders’ equity 27.2% 2.4% 38.3% 35.2% 38.9%
Basic earnings (loss) per share
Continuing operations 2.72 .28 4.62 4.38 4.30
Discontinued operations (.08) (.02) — — —
Total 2.64 .26 4.62 4.38 4.30
Diluted earnings (loss) per share
Continuing operations 2.72 .28 4.59 4.33 4.24
Discontinued operations (.08) (.02) — — —
Total 2.64 .26 4.59 4.33 4.24
Cash dividends paid
—on common shares 525 643 545 563 569
—per common share 1.80 2.21 1.76 1.76 1.76
Common shares outstanding at year end 285.9 290.9 290.5 310.4 322.8
Shareholders at year end 89,988 91,893 113,308 131,719 129,495
Statement of Financial Position Data
Operational working capital(8) $ 599 $ 797 $ 1,420 $ 777 $ 874
Working capital (843) (737) (786) (385) (643)
Property, plant and equipment, net 5,420 5,659 5,919 5,947 5,914
Total assets 13,369 13,362 14,212 14,370 14,733
Short-term borrowings and
current portion of long-term debt 1,442 1,534 2,206 1,163 1,518
Long-term debt, net of current portion 1,164 1,666 1,166 936 504
Total shareholders’ equity 2,777 2,894 3,428 3,912 3,988
Supplemental Information
Net sales from continuing operations
Photography $ 9,002 $ 9,403 $ 10,231 $ 10,265 $ 10,063
Health Imaging 2,274 2,262 2,220 2,159 1,526
Commercial Imaging 1,456 1,454 1,417 1,479 1,296
All Other 103 110 126 186 521
Research and development costs 762 779 784 817 922(7)
Depreciation 818 765 738 773 737
Taxes (excludes payroll, sales and excise taxes) 288 154 933 806 809
Wages, salaries and employee benefits 3,991 3,824 3,726 3,962 4,306
Employees at year end
—in the U.S 39,000 42,000 43,200 43,300 46,300
—worldwide 70,000 75,100 78,400 80,650 86,200
Net earnings