Kodak 2002 Annual Report Download - page 43
Download and view the complete annual report
Please find page 43 of the 2002 Kodak annual report below. You can navigate through the pages in the report by either clicking on the pages listed below, or by using the keyword search tool below to find specific information within the annual report.-
 1
1 -
2
-
3
-
4
-
5
-
6
-
7
-
8
-
9
-
10
-
11
-
12
-
13
-
14
-
15
-
16
-
17
-
18
-
19
-
20
-
21
-
22
-
23
-
24
-
25
-
26
-
27
-
28
-
29
-
30
-
31
-
32
-
 33
33 -
 34
34 -
 35
35 -
 36
36 -
 37
37 -
 38
38 -
 39
39 -
 40
40 -
 41
41 -
 42
42 -
 43
43 -
 44
44 -
 45
45 -
 46
46 -
 47
47 -
 48
48 -
 49
49 -
 50
50 -
 51
51 -
 52
52 -
 53
53 -
54
-
55
-
56
-
57
-
58
-
59
-
60
-
61
-
62
-
63
-
64
-
65
-
66
-
67
-
68
-
69
-
70
-
71
-
72
-
73
-
74
-
75
-
76
-
77
-
78
-
79
-
80
-
81
-
82
-
83
-
84
-
85
-
86
-
87
-
88
-
89
-
90
-
91
-
92
-
93
-
94
-
95
-
96
-
97
-
98
-
99
-
100
-
101
-
102
-
103
-
104
-
105
-
106
-
107
-
108
-
109
-
110
-
111
-
112
-
113
-
114
-
115
-
116
-
117
-
118
-
119
-
120
-
121
-
122
-
123
-
124
 |
 |

Financials
43
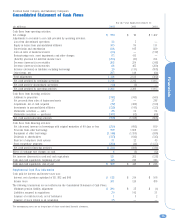
Eastman Kodak Company and Subsidiary Companies
Consolidated Statement of Cash Flows
For the Year Ended December 31
(in millions) 2002 2001 2000
Cash flows from operating activities:
Net earnings $ 770 $ 76 $ 1,407
Adjustments to reconcile to net cash provided by operating activities:
Loss from discontinued operations 23 5—
Equity in losses from unconsolidated affiliates 105 84 111
Depreciation and amortization 818 917 889
Gain on sales of businesses/assets (24) — (117)
Restructuring costs, asset impairments and other charges 85 415 —
(Benefit) provision for deferred income taxes (224) (41) 234
Decrease (increase) in receivables 263 254 (247)
Decrease (increase) in inventories 88 465 (280)
Increase (decrease) in liabilities excluding borrowings 29 (111) (808)
Other items, net 285 149 (84)
Total adjustments 1,448 2,137 (302)
Net cash provided by continuing operations 2,218 2,213 1,105
Net cash used for discontinued operations (14) (7) —
Net cash provided by operating activities 2,204 2,206 1,105
Cash flows from investing activities:
Additions to properties (577) (743) (945)
Net proceeds from sales of businesses/assets 27 — 277
Acquisitions, net of cash acquired (72) (306) (130)
Investments in unconsolidated affiliates (123) (141) (123)
Marketable securities — sales 88 54 84
Marketable securities — purchases (101) (52) (69)
Net cash used in investing activities (758) (1,188) (906)
Cash flows from financing activities:
Net (decrease) increase in borrowings with original maturities of 90 days or less (210) (695) 939
Proceeds from other borrowings 759 1,907 1,310
Repayment of other borrowings (1,146) (1,355) (936)
Dividends to shareholders (525) (643) (545)
Exercise of employee stock options 51 22 43
Stock repurchase programs (260) (44) (1,125)
Net cash used in financing activities (1,331) (808) (314)
Effect of exchange rate changes on cash 6(8) (12)
Net increase (decrease) in cash and cash equivalents 121 202 (127)
Cash and cash equivalents, beginning of year 448 246 373
Cash and cash equivalents, end of year $ 569 $ 448 $ 246
Supplemental Cash Flow Information
Cash paid for interest and income taxes was:
Interest, net of portion capitalized of $3, $12 and $40 $ 173 $ 214 $ 166
Income taxes 201 120 486
The following transactions are not reflected in the Consolidated Statement of Cash Flows:
Minimum pension liability adjustment $ 394 $ 37 $ (1)
Liabilities assumed in acquisitions 30 142 31
Issuance of restricted stock, net of forfeitures 152
Issuance of stock related to an acquisition 25 ——
The accompanying notes are an integral part of these consolidated financial statements.
For the Year Ended December 31