John Deere 2009 Annual Report Download - page 18
Download and view the complete annual report
Please find page 18 of the 2009 John Deere annual report below. You can navigate through the pages in the report by either clicking on the pages listed below, or by using the keyword search tool below to find specific information within the annual report.-
 1
1 -
2
-
3
-
4
-
5
-
6
-
7
-
 8
8 -
 9
9 -
 10
10 -
 11
11 -
 12
12 -
 13
13 -
 14
14 -
 15
15 -
 16
16 -
 17
17 -
 18
18 -
 19
19 -
 20
20 -
 21
21 -
 22
22 -
 23
23 -
 24
24 -
 25
25 -
 26
26 -
 27
27 -
 28
28 -
29
-
30
-
31
-
32
-
33
-
34
-
35
-
36
-
37
-
38
-
39
-
40
-
41
-
42
-
43
-
44
-
45
-
46
-
47
-
48
-
49
-
50
-
51
-
52
-
53
-
54
-
55
-
56
 |
 |

FINANCIAL SERVICES
The Financial Services’ credit operations rely on their ability to
raise substantial amounts of funds to fi nance their receivable and
lease portfolios. Their primary sources of funds for this purpose
are a combination of commercial paper, term debt, securitization
of retail notes and equity capital.
Cash fl ows from the Financial Services’ operating activities,
including intercompany cash fl ows, were $897 million in 2009.
The cash provided by operating activities was used primarily for
investing and fi nancing activities. Cash used by investing activities
totaled $331 million in 2009, primarily due to the cost of
receivables and equipment on operating leases exceeding
collections of receivables and the proceeds from sales of equip-
ment on operating leases by $265 million and purchases of
property and equipment of $119 million, partially offset by
proceeds from sales of fi nancing receivables of $34 million.
Cash used for fi nancing activities totaled $796 million in 2009,
representing primarily a decrease in borrowings from Deere &
Company of $551 million and a $189 million decrease in external
borrowings. Cash and cash equivalents decreased $215 million.
Over the last three years, the Financial Services’
operating activities, including intercompany cash fl ows, have
provided $2,687 million in cash. In addition, an increase in
total borrowings of $2,488 million, capital investment from
Deere & Company of $663 million and proceeds from sales
of fi nancing receivables of $353 million provided cash infl ows.
These amounts have been used mainly to fund receivable and
equipment on operating lease acquisitions, which exceeded
collections and the proceeds from sales of equipment on operating
leases by $3,268 million, pay dividends to Deere & Company of
$1,153 million and fund purchases of property and equipment
of $923 million. Cash and cash equivalents also increased $751
million over the three-year period.
Receivables and equipment on operating leases increased by
$482 million in 2009, compared with 2008. Acquisition volumes
of receivables and equipment on operating leases decreased
7 percent in 2009, compared with 2008. The volumes of whole-
sale notes and revolving charge accounts increased approxi-
mately 34 percent and 1 percent, respectively. The volumes
of operating loans, fi nancing leases, retail notes, operating leases
and trade receivables decreased approximately 54 percent,
31 percent, 15 percent, 8 percent and 8 percent, respectively.
At October 31, 2009 and 2008, net receivables and leases
administered, which include receivables administered but not
owned, were $22,729 million and $22,281 million, respectively.
Total external interest-bearing debt of the credit operations
was $20,988 million at the end of 2009, compared with $20,210
million at the end of 2008 and $19,665 million at the end of
2007. Included in this debt are secured borrowings of $3,132
million at the end of 2009, $1,682 million at the end of 2008
and $2,344 million at the end of 2007. Total external borrowings
have increased generally corresponding with the level of the
receivable and lease portfolio, the level of cash and cash equiva-
lents and the change in payables owed to Deere & Company.
The credit operations’ ratio of total interest-bearing debt to total
stockholder’s equity was 7.4 to 1 at the end of 2009, 8.3 to 1 at
the end of 2008 and 8.2 to 1 at the end of 2007.
During 2009, the credit operations issued $4,898 million
and retired $3,755 million of long-term borrowings.
The retirements included $300 million of 6% Notes due 2009
and the remainder consisted primarily of medium-term notes.
Property and equipment cash expenditures for Financial
Services in 2009 were $119 million, compared with $339 million
in 2008, primarily related to investments in wind energy
generation in both years. Capital expenditures for 2010 are
estimated to be approximately $200 million, also primarily
related to investments in wind energy generation.
OFF-BALANCE-SHEET ARRANGEMENTS
The company’s credit operations offer crop insurance products
through managing general agency agreements (Agreements)
with insurance companies (Insurance Carriers) rated “Excellent”
by A.M. Best Company. The credit operations have guaranteed
certain obligations under the Agreements, including the
obligation to pay the Insurance Carriers for any uncollected
premiums. At October 31, 2009, the maximum exposure for
uncollected premiums was approximately $60 million.
Substantially all of the crop insurance risk under the Agreements
have been mitigated by a syndicate of private reinsurance
companies. In the event of a widespread catastrophic crop
failure throughout the U.S. and the default of all the reinsurance
companies on their obligations, the company would be required
to reimburse the Insurance Carriers approximately $981 million
at October 31, 2009. The company believes the likelihood of
this event is substantially remote.
At October 31, 2009, the company had approximately
$170 million of guarantees issued primarily to banks outside the
U.S. related to third-party receivables for the retail fi nancing
of John Deere equipment. The company may recover a portion
of any required payments incurred under these agreements from
repossession of the equipment collateralizing the receivables.
The maximum remaining term of the receivables guaranteed at
October 31, 2009 was approximately six years.
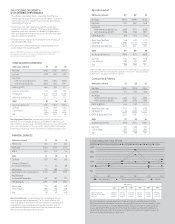
AGGREGATE CONTRACTUAL OBLIGATIONS
The payment schedule for the company’s contractual obligations
at October 31, 2009 in millions of dollars is as follows:
Less More
than 2&3 4&5 than
Total 1 year years years 5 years
Debt*
Equipment Operations ....
$ 3,469 $ 490 $ 173 $ 700 $ 2,106
Financial Services** ....... 20,578 5,090 9,626 3,823 2,039
Total ......................... 24,047 5,580 9,799 4,523 4,145
Interest on debt ................. 4,468 803 1,285 561 1,819
Accounts payable .............. 1,784 1,668 81 31 4
Purchase obligations .......... 2,270 2,242 21 6 1
Operating leases ................ 544 128 180 95 141
Capital leases .................... 56 19 19 4 14
Total ................................ $ 33,169 $ 10,440 $ 11,385 $ 5,220 $ 6,124
* Principal payments.
** Notes payable of $3,132 million classifi ed as short-term on the balance sheet
related to the securitization of retail notes are included in this table based on the
expected payment schedule (see Note 18).
19
18