John Deere 2009 Annual Report Download - page 15
Download and view the complete annual report
Please find page 15 of the 2009 John Deere annual report below. You can navigate through the pages in the report by either clicking on the pages listed below, or by using the keyword search tool below to find specific information within the annual report.-
 1
1 -
2
-
3
-
4
-
 5
5 -
 6
6 -
 7
7 -
 8
8 -
 9
9 -
 10
10 -
 11
11 -
 12
12 -
 13
13 -
 14
14 -
 15
15 -
 16
16 -
 17
17 -
 18
18 -
 19
19 -
 20
20 -
 21
21 -
 22
22 -
 23
23 -
 24
24 -
 25
25 -
26
-
27
-
28
-
29
-
30
-
31
-
32
-
33
-
34
-
35
-
36
-
37
-
38
-
39
-
40
-
41
-
42
-
43
-
44
-
45
-
46
-
47
-
48
-
49
-
50
-
51
-
52
-
53
-
54
-
55
-
56
 |
 |

16
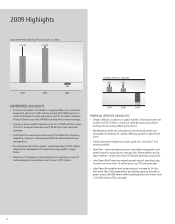
Worldwide Equipment Operations had an operating
profi t of $2,927 million in 2008, compared with $2,318 million
in 2007. Higher operating profi t was primarily due to the
favorable impact of higher shipment volumes and improved
price realization. Partially offsetting these factors were increased
raw material costs, higher selling, administrative and general
expenses, increased research and development costs and
expenses to close a facility in Canada (see Note 5).
The Equipment Operations’ net income was $1,676 million
in 2008, compared with $1,429 million in 2007. The same
operating factors mentioned above as well as a higher effective
tax rate in 2008 affected these results.
Net income of the company’s Financial Services operations
in 2008 decreased to $337 million, compared with $364 million
in 2007. The decrease was primarily a result of increased selling,
administrative and general expenses, an increase in average
leverage and a higher provision for credit losses, partially offset
by growth in the average credit portfolio. Additional information
is presented in the following discussion of the credit operations.
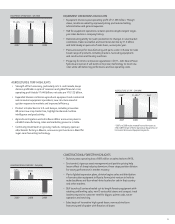
The cost of sales to net sales ratio for 2008 was 75.9 percent,
compared with 75.6 percent in 2007. The increase was primarily
due to higher raw material costs, partially offset by higher sales
and production volumes and improved price realization.
Other income increased in 2008 primarily from increased
crop insurance commissions. Research and development costs
increased in 2008 primarily due to increased spending in support
of new products, Tier 4 emission requirements and the effect of
currency translation. Selling, administrative and general expenses
increased in 2008 primarily due to growth and acquisitions, the
effect of currency translation and the provision for credit losses.
Other operating expenses were higher in 2008 primarily as a
result of higher expenses related to wind energy entities, expenses
from crop insurance, depreciation on operating lease equipment
and foreign exchange losses.
The company has several defi ned benefi t pension plans
and defi ned benefi t health care and life insurance plans.
The company’s postretirement benefi t costs for these plans in
2008 were $277 million, compared with $415 million in 2007.
The long-term expected return on plan assets, which is refl ected
in these costs, was an expected gain of 8.2 percent in 2008 and
8.3 percent in 2007, or $920 million in 2008 and $838 million
in 2007. The actual return was a loss of $2,158 million in 2008
and a gain of $1,503 million in 2007. Total company contribu-
tions to the plans were $431 million in 2008 and $646 million
in 2007, which include direct benefi t payments for unfunded
plans. These contributions also included voluntary contributions
to total plan assets of approximately $297 million in 2008 and
$520 million in 2007.
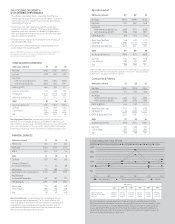
BUSINESS SEGMENT AND GEOGRAPHIC AREA RESULTS
Worldwide Agriculture and Turf Operations
The agriculture and turf segment had an operating profi t of
$2,461 million in 2008, compared with $1,747 million in 2007.
Net sales increased 28 percent in 2008 due to higher shipment
volumes, the favorable effects of currency translation and
improved price realization. The increase in operating profi t in
2008 was primarily due to higher shipment volumes and
improved price realization, partially offset by higher raw material
costs, increased selling, administrative and general expenses,
higher research and development costs and expenses to close a
facility in Canada.
Worldwide Construction and Forestry Operations
The construction and forestry segment had an operating profi t
of $466 million in 2008, compared with $571 million in 2007.
Net sales decreased 4 percent in 2008 refl ecting the pressure
from U.S. market conditions. The operating profi t was lower in
2008 primarily due to lower shipment volumes and higher raw
material costs, partially offset by improved price realization.
Worldwide Credit Operations
The operating profi t of the credit operations was $478 million
in 2008, compared with $548 million in 2007. The decrease in
operating profi t in 2008 was primarily due to higher selling,
administrative and general expenses, an increase in average
leverage, a higher provision for credit losses and foreign exchange
losses, partially offset by growth in the average credit portfolio
and increased commissions from crop insurance. Total revenues
of the credit operations, including intercompany revenues,
increased 3 percent in 2008, primarily refl ecting the larger
portfolio. The average balance of receivables and leases fi nanced
was 6 percent higher in 2008, compared with 2007. An increase
in average borrowings, offset by lower average interest rates,
resulted in approximately the same interest expense in both
2008 and 2007. The credit operations’ ratio of earnings to fi xed
charges was 1.45 to 1 in 2008, compared with 1.55 to 1 in 2007.
Equipment Operations in U.S. and Canada
The equipment operations in the U.S. and Canada had an
operating profi t of $1,831 million in 2008, compared with
$1,539 million in 2007. The increase was primarily due to
higher shipment volumes and improved price realization,
partially offset by higher raw material costs, increased selling,
administrative and general expenses, higher research and
development costs and expenses to close the previously
mentioned Canadian facility. Net sales increased 9 percent in
2008 due to higher volumes, improved price realization and
the favorable effects of currency translation. The physical
volume increased 4 percent in 2008 excluding acquisitions,
compared with 2007.
15