John Deere 2009 Annual Report Download - page 10
Download and view the complete annual report
Please find page 10 of the 2009 John Deere annual report below. You can navigate through the pages in the report by either clicking on the pages listed below, or by using the keyword search tool below to find specific information within the annual report.-
 1
1 -
 2
2 -
 3
3 -
 4
4 -
 5
5 -
 6
6 -
 7
7 -
 8
8 -
 9
9 -
 10
10 -
 11
11 -
 12
12 -
 13
13 -
 14
14 -
 15
15 -
 16
16 -
 17
17 -
 18
18 -
 19
19 -
 20
20 -
 21
21 -
22
-
23
-
24
-
25
-
26
-
27
-
28
-
29
-
30
-
31
-
32
-
33
-
34
-
35
-
36
-
37
-
38
-
39
-
40
-
41
-
42
-
43
-
44
-
45
-
46
-
47
-
48
-
49
-
50
-
51
-
52
-
53
-
54
-
55
-
56
 |
 |

DEERE EQUIPMENT OPERATIONS
$MM unless indicated 07 08 09
Net Sales 21489 25803 20756
Op Profit 2318 2927 1365
Avg Assets
With Inventories @ Std Cost 9205 10812 10950
With Inventories @ LIFO 8092 9652 9647
OROA % @ LIFO 28.6 30.3 14.1
Asset Turns (Std Cost) 2.33 2.39 1.90
Op Margin % x10.79 x11.34 x 6.58
OROA % @ Standard Cost 25.2 27.1 12.5
$MM 07 08 09
Avg Assets @ Std Cost 9205 10812 10950
Op Profit 2318 2927 1365
Cost of Assets -1094 -1284 -1301
SVA 1224 1643 64
Deere Financial Services, to create and grow SVA, are targeting an after-tax
return on average equity of approximately 13%. The Financial Services SVA
metric is calculated on a pretax basis, with certain adjustments. Operating profit
is adjusted for changes in the allowance for doubtful receivables, while the
actual allowance is added to the equity base. These adjustments are made to
reflect actual write-offs in both income and equity.
Agriculture & Turf
$MM unless indicated 07* 08* 09
Net Sales 16454 20985 18122
Op Profit 1747 2461 1448
Avg Assets
With Inventories @ Std Cost 6649 8171 8500
With Inventories @ LIFO 5708 7196 7397
OROA % @ LIFO 30.6 34.2 19.6
Asset Turns (Std Cost) 2.48 2.57 2.13
Op Margin % x 10.62 x 11.73 x 7.99
OROA % @ Standard Cost 26.3 30.1 17.0
$MM 07* 08* 09
Avg Assets @ Std Cost 6649 8171 8500
Op Profit 1747 2461 1448
Cost of Assets -787 -967 -1007
SVA 960 1494 441
SVA: FOCUSING ON GROWTH
& SUSTAINABLE PERFORMANCE
• Shareholder Value Added (SVA) – essentially, the difference
between operating profi t and pretax cost of capital – is a metric
used by John Deere to evaluate business results and measure
sustainable performance.
• In arriving at SVA, each equipment segment is assessed a
pretax cost of assets – generally 12% of average identifi able
operating assets with inventory at standard cost (believed to
more closely approximate the current cost of inventory and the
company’s related investment).
• Financial-services businesses are assessed a cost of equity of
approximately 18% pretax.
• The amount of SVA is determined by deducting the asset or
equity charge from operating profi t.
Additional information on these metrics and their relationship to amounts presented in
accordance with U.S. GAAP can be found at our Web site, www.JohnDeere.com.
Note: Some totals may vary due to rounding.
*2007 and 2008 fi gures are the combined results of the former Agricultural Equipment
and Commercial & Consumer Equipment segments for those years. They were merged
in 2009 to form the Agriculture and Turf segment.
Deere Equipment Operations, to create and grow SVA, are targeting an
operating return on average operating assets (OROA) of 20% at mid-cycle
sales volumes in any given year – and other ambitious returns at other points
in the cycle. (For purposes of this calculation, operating assets are average
identifi able assets during the year with inventories valued at standard cost.)
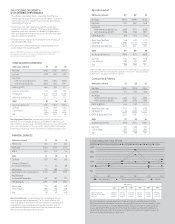
5-YEAR CUMULATIVE TOTAL RETURN
DEERE COMPARED TO S&P 500 INDEX AND S&P 500 CONSTRUCTION & FARM MACHINERY INDEX
Deere & Company S&P Construction & Farm Machinery S&P 500
Deere & Company $100.00 $103.37 $147.97 $273.51 $138.21 $168.00
S&P Con & Farm Mach $100.00 $117.50 $149.33 $219.62 $105.94 $146.54
S&P 500 $100.00 $108.72 $126.49 $144.90 $92.60 $101.68
At October 31
The graph compares the cumulative total returns of Deere & Company, the S&P 500 Construction & Farm
Machinery Index, and the S&P 500 Stock Index over a fi ve-year period. It assumes $100 was invested on October
31, 2004, and that dividends are reinvested. Deere & Company stock price at October 31, 2009, was $45.55.
The Standard & Poor’s 500 Construction & Farm Machinery Index is made up of Deere (DE), Caterpillar (CAT),
Paccar (PCAR), and Cummins (CMI). The stock performance shown in the graph is not intended to forecast and
does not necessarily indicate future price performance.
2004 2005 2006 2007 2008 2009
2004 2005 2006 2007 2008 2009
$300
$250
$200
$150
$100
$50
FINANCIAL SERVICES
$MM unless indicated 07 08 09
Net Income 364 337 203
Avg Equity 2524 2355 2732
ROE % 14.4 14.3 7.4
$MM 07 08 09
Op Profit 553 493 242
Change in Allowance
for Doubtful Receivables 17 (4) 68
SVA Income 570 489 310
Avg Equity Continuing Operations 2524 2355 2732
Avg Allowance
for Doubtful Receivables 167 183 195
SVA Avg Equity 2691 2538 2927
SVA Income 570 489 310
Cost of Equity -480 -430 -458
SVA 90 59 -148
Construction & Forestry
$MM unless indicated 07 08 09
Net Sales 5035 4818 2634
Op Profit 571 466 (83)
Avg Assets
With Inventories @ Std Cost 2556 2641 2450
With Inventories @ LIFO 2384 2456 2250
OROA % @ LIFO 24.0 19.0 -3.7
Asset Turns (Std Cost) 1.97 1.82 1.08
Op Margin % x 11.34 x 9.67 x -3.15
OROA % @ Standard Cost 22.3 17.6 -3.4
$MM 07 08 09
Avg Assets @ Std Cost 2556 2641 2450
Op Profit 571 466 -83
Cost of Assets -307 -317 -294
SVA 264 149 -377