Jack In The Box 2011 Annual Report Download - page 4
Download and view the complete annual report
Please find page 4 of the 2011 Jack In The Box annual report below. You can navigate through the pages in the report by either clicking on the pages listed below, or by using the keyword search tool below to find specific information within the annual report.-
 1
1 -
 2
2 -
 3
3 -
 4
4 -
 5
5 -
 6
6 -
 7
7 -
 8
8 -
 9
9 -
 10
10 -
 11
11 -
 12
12 -
 13
13 -
 14
14 -
 15
15 -
16
-
17
-
18
-
19
-
20
-
21
-
22
-
23
-
24
-
25
-
26
-
27
-
28
-
29
-
30
-
31
-
32
-
33
-
34
-
35
-
36
-
37
-
38
-
39
-
40
-
41
-
42
-
43
-
44
-
45
-
46
-
47
-
48
-
49
-
50
-
51
-
52
-
53
-
54
-
55
-
56
-
57
-
58
-
59
-
60
-
61
-
62
-
63
-
64
-
65
-
66
-
67
-
68
-
69
-
70
-
71
-
72
-
73
-
74
-
75
-
76
-
77
-
78
-
79
-
80
-
81
-
82
-
83
-
84
-
85
-
86
-
87
-
88
-
89
 |
 |

Table of Contents
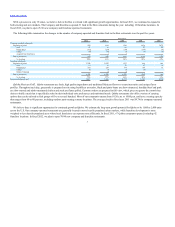
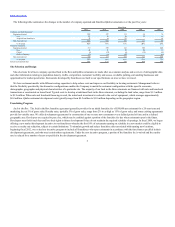
With a presence in only 19 states, we believe Jack in the Box is a brand with significant growth opportunities. In fiscal 2011, we continued to expand in
both existing and new markets. The Company and franchisees opened 31 Jack in the Box restaurants during the year, including 16 franchise locations. In
fiscal 2012, we plan to open 25-30 new company and franchise operated restaurants.
The following table summarizes the changes in the number of company-operated and franchise Jack in the Box restaurants over the past five years:
Company-operated restaurants:
Beginning of period 956 1,190 1,346 1,436 1,475
New 15 30 43 23 42
Refranchised (332) (219) (194) (109) (76)
Closed (10) (46) (6) (4) (5)
Acquired from franchisees - 1 1 - -
End of period total 629 956 1,190 1,346 1,436
% of system 28% 43% 54% 62% 67%
Franchise restaurants:
Beginning of period 1,250 1,022 812 696 604
New 16 16 21 15 16
Refranchised 332 219 194 109 76
Closed (6) (6) (4) (8) -
Sold to Company - (1) (1) - -
End of period total 1,592 1,250 1,022 812 696
% of system 72% 57% 46% 38% 33%
System end of period total 2,221 2,206 2,212 2,158 2,132
Qdoba Mexican Grill. Qdoba restaurants use fresh, high quality ingredients and traditional Mexican flavors to create innovative and unique flavor
profiles. Throughout each day, guacamole is prepared on site using fresh Hass avocados, black and pinto beans are slow-simmered, shredded beef and pork
are slow-roasted and adobo-marinated chicken and steak are flame-grilled. Customer orders are prepared in full view, which gives our guests the control they
desire to build a meal that is specifically suited to their individual taste preferences and nutritional needs. Qdoba restaurants also offer a variety of catering
options that can be tailored to feed groups of five to several hundred. Most of our restaurants operate from 10:30 a.m. to 10:00 p.m. and have a seating capacity
that ranges from 60 to 80 persons, including outdoor patio seating at many locations. The average check in fiscal year 2011 was $9.74 for company-operated
restaurants.
We believe there is significant opportunity for continued growth at Qdoba. We estimate the long-term growth potential for Qdoba to be 1,800 to 2,000 units
across the U.S. Our company-operated restaurants are generally located in more heavily populated urban markets, while franchise development is more
weighted to less densely-populated areas where local franchisees can operate more efficiently. In fiscal 2011, 67 Qdoba restaurants opened, including 42
franchise locations. In fiscal 2012, we plan to open 70-90 new company and franchise restaurants.
3