Jack In The Box 2010 Annual Report Download - page 6
Download and view the complete annual report
Please find page 6 of the 2010 Jack In The Box annual report below. You can navigate through the pages in the report by either clicking on the pages listed below, or by using the keyword search tool below to find specific information within the annual report.-
 1
1 -
 2
2 -
 3
3 -
 4
4 -
 5
5 -
 6
6 -
 7
7 -
 8
8 -
 9
9 -
 10
10 -
 11
11 -
 12
12 -
 13
13 -
 14
14 -
 15
15 -
 16
16 -
 17
17 -
18
-
19
-
20
-
21
-
22
-
23
-
24
-
25
-
26
-
27
-
28
-
29
-
30
-
31
-
32
-
33
-
34
-
35
-
36
-
37
-
38
-
39
-
40
-
41
-
42
-
43
-
44
-
45
-
46
-
47
-
48
-
49
-
50
-
51
-
52
-
53
-
54
-
55
-
56
-
57
-
58
-
59
-
60
-
61
-
62
-
63
-
64
-
65
-
66
-
67
-
68
-
69
-
70
-
71
-
72
-
73
-
74
-
75
-
76
-
77
-
78
-
79
-
80
-
81
-
82
-
83
-
84
-
85
-
86
-
87
-
88
-
89
-
90
-
91
-
92
-
93
 |
 |

Table of Contents
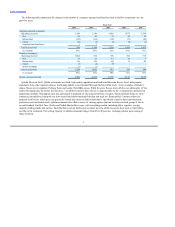
The following table summarizes the changes in the number of company-operated and franchise Qdoba restaurants over the past five
years:
Company-operated restaurants:
Beginning of period 157 111 90 70 57
New 15 24 21 10 13
Refranchised - - - - -
Closed - - - - -
Acquired from franchisees 16 22 - 10 -
End of period total 188 157 111 90 70
% of system 36% 31% 24% 23% 22%
Franchise restaurants:
Beginning of period 353 343 305 248 193
New 21 38 56 77 58
Refranchised - - - - -
Closed (21) (6) (18) (10) (3)
Sold to Company (16) (22) - (10) -
End of period total 337 353 343 305 248
% of system 64% 69% 76% 77% 78%
System end of period total 525 510 454 395 318
Site selections for all new company-operated restaurants are made after an economic analysis and a review of demographic data and
other information relating to population density, traffic, competition, restaurant visibility and access, available parking, surrounding
businesses and opportunities for market penetration. Restaurants developed by franchisees are built to our specifications on sites we have
reviewed.
We have a restaurant prototype with different seating capacities to help reduce costs and improve our flexibility in locating restaurants.
Management believes that the flexibility provided by the alternative configurations enables the Company to match the restaurant
configuration with the specific economic, demographic, geographic and physical characteristics of a particular site. The majority of our
Jack in the Box restaurants are financed with sale and leaseback transactions or constructed on leased land. Typical costs to develop a
traditional Jack in the Box restaurant, excluding the land value, range from $1.2 million to $1.9 million. When sale and leaseback
financing is used, the initial cash investment is reduced to the cost of equipment, which averages approximately $0.4 million. Qdoba
restaurant development costs typically range from $0.5 million to $0.9 million depending on geographic region.
. The Jack in the Box franchise agreement generally provides for an initial franchise fee of $50,000 per restaurant for a
20-year term, and in most instances, marketing fees at 5% of gross sales. Royalty rates, typically 5% of gross sales, range from 2% to as
high as 15% of gross sales, and some existing agreements provide for variable rates. We offer development agreements for construction of
one or more new restaurants over a defined period of time and in a defined geographic area. Developers are required to pay a fee, a portion
of which may be credited against franchise fees due when restaurants open in the future. Developers may forfeit such fees and lose their
rights to future development if they do not maintain the required schedule of openings. In fiscal 2009, we began offering a new market
development incentive to our franchisees whereby the first 10% of restaurants opening on schedule in a new market may be eligible to
receive a royalty rate reduction of 2.5% of gross sales for the first two years after opening, subject to certain limitations.
In connection with the sale of a company-operated restaurant, the restaurant equipment and the right to do business at that location are
sold to the franchisee. The aggregate price is equal to the negotiated fair market value of the restaurant as a going concern, which depends
on various factors, including the sales and cash flows of the
5