JP Morgan Chase 2014 Annual Report Download - page 20
Download and view the complete annual report
Please find page 20 of the 2014 JP Morgan Chase annual report below. You can navigate through the pages in the report by either clicking on the pages listed below, or by using the keyword search tool below to find specific information within the annual report.-
 1
1 -
2
-
3
-
4
-
5
-
6
-
7
-
8
-
9
-
 10
10 -
 11
11 -
 12
12 -
 13
13 -
 14
14 -
 15
15 -
 16
16 -
 17
17 -
 18
18 -
 19
19 -
 20
20 -
 21
21 -
 22
22 -
 23
23 -
 24
24 -
 25
25 -
 26
26 -
 27
27 -
 28
28 -
 29
29 -
 30
30 -
31
-
32
-
33
-
34
-
35
-
36
-
37
-
38
-
39
-
40
-
41
-
42
-
43
-
44
-
45
-
46
-
47
-
48
-
49
-
50
-
51
-
52
-
53
-
54
-
55
-
56
-
57
-
58
-
59
-
60
-
61
-
62
-
63
-
64
-
65
-
66
-
67
-
68
-
69
-
70
-
71
-
72
-
73
-
74
-
75
-
76
-
77
-
78
-
79
-
80
-
81
-
82
-
83
-
84
-
85
-
86
-
87
-
88
-
89
-
90
-
91
-
92
-
93
-
94
-
95
-
96
-
97
-
98
-
99
-
100
-
101
-
102
-
103
-
104
-
105
-
106
-
107
-
108
-
109
-
110
-
111
-
112
-
113
-
114
-
115
-
116
-
117
-
118
-
119
-
120
-
121
-
122
-
123
-
124
-
125
-
126
-
127
-
128
-
129
-
130
-
131
-
132
-
133
-
134
-
135
-
136
-
137
-
138
-
139
-
140
-
141
-
142
-
143
-
144
-
145
-
146
-
147
-
148
-
149
-
150
-
151
-
152
-
153
-
154
-
155
-
156
-
157
-
158
-
159
-
160
-
161
-
162
-
163
-
164
-
165
-
166
-
167
-
168
-
169
-
170
-
171
-
172
-
173
-
174
-
175
-
176
-
177
-
178
-
179
-
180
-
181
-
182
-
183
-
184
-
185
-
186
-
187
-
188
-
189
-
190
-
191
-
192
-
193
-
194
-
195
-
196
-
197
-
198
-
199
-
200
-
201
-
202
-
203
-
204
-
205
-
206
-
207
-
208
-
209
-
210
-
211
-
212
-
213
-
214
-
215
-
216
-
217
-
218
-
219
-
220
-
221
-
222
-
223
-
224
-
225
-
226
-
227
-
228
-
229
-
230
-
231
-
232
-
233
-
234
-
235
-
236
-
237
-
238
-
239
-
240
-
241
-
242
-
243
-
244
-
245
-
246
-
247
-
248
-
249
-
250
-
251
-
252
-
253
-
254
-
255
-
256
-
257
-
258
-
259
-
260
-
261
-
262
-
263
-
264
-
265
-
266
-
267
-
268
-
269
-
270
-
271
-
272
-
273
-
274
-
275
-
276
-
277
-
278
-
279
-
280
-
281
-
282
-
283
-
284
-
285
-
286
-
287
-
288
-
289
-
290
-
291
-
292
-
293
-
294
-
295
-
296
-
297
-
298
-
299
-
300
-
301
-
302
-
303
-
304
-
305
-
306
-
307
-
308
-
309
-
310
-
311
-
312
-
313
-
314
-
315
-
316
-
317
-
318
-
319
-
320
 |
 |

1818
II. BUILT FOR THE LONG TERM
consistent over time and is not in any way
capricious. Capital is precious, and it needs to
be deployed intelligently in the business or
properly returned to shareholders. If share-
holders do not have a clear understanding of
capital management and have unreasonable
expectations, then that capital will be devalued.
This is a bad outcome for all involved.
While there always will be cycles, we need to
keep our eye on the important things, too —
the outlook for long-term growth is excellent
The needs of countries, companies, investor
clients and individuals will continue to grow
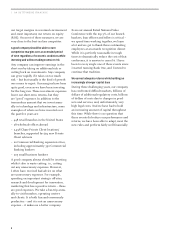
over time. The chart below shows some of
the long-term growth that is expected in
some critical areas, including the underlying
growth of gross domestic product and trade,
investable/financial assets, infrastructure and
capital markets activities. This is the fuel that
will drive our business in the future.
Therefore, we take a long-term perspective
on investing. How we currently view low net
interest margins is a good example of making
decisions for the long run
To capture our share of the growth in our
underlying businesses, we need to continu-
ally invest in bankers, branches and capabili-
ties (research, products and technology) to
drive down our costs and better serve our
clients. It is a lot of hard work that needs to
be supported by all of our critical functions,
from finance and human resources to opera-
tions and controls. This kind of investing
should not be done in a stop-start way to
manage short-term profitability.
Quarterly earnings – even annual earnings
– frequently are the result of actions taken
over the past five or 10 years. Our company
continued to invest through the crisis – often
when others could not – in order to capture
future growth.
Global Macro Themes
2014 2024 Growth
World gross
domestic product
($ in trillions)
$ 78 $ 133 5.5% CAGR
World exports
($ in trillions)
$ 22 $ 38 1.7x
Investable assets
($ in trillions)
$ 263 $ 481 6% CAGR
12% emerging
4% developed
Infrastructure
spend
($ in trillions)
$36 over last 18 years $57 over next 18 years 1.6x
2.6x emerging
1.1x developed
Number of
companies with
$1+ billion revenue
8,000 15,0001 1.9x
3.8x emerging
1.2x developed
Source: International Monetary Fund, World Bank, McKinsey, JPMorgan Chase analysis
1 2025 estimate