JP Morgan Chase 2014 Annual Report Download - page 12
Download and view the complete annual report
Please find page 12 of the 2014 JP Morgan Chase annual report below. You can navigate through the pages in the report by either clicking on the pages listed below, or by using the keyword search tool below to find specific information within the annual report.
1010
I. AN OUTSTANDING FRANCHISE
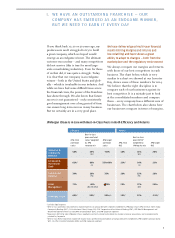
Our businesses have been able to gain market
share, which only happens when we are
creating happy clients
Importantly, much of the growth has been
organic. Please review some of the numbers in
the chart above – they speak for themselves.
If you had asked me back in 2006 if we could
have accomplished those kinds of market
share numbers, I would have been skeptical.
And, fortunately, we have plenty of areas
where we still can grow or do better – I will
talk about this in a later section of this letter.
Most of our businesses have exhibited improving
customer satisfaction
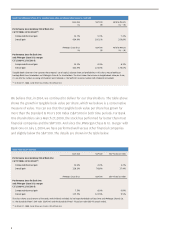
The chart on the next page shows the great
progress that our Consumer Bank has made
in improving satisfaction scores. In fact,
American Customer Satisfaction Index
named Chase #1 in customer satisfaction
among large banks in 2014. We have received
even better scores than most of the regional
banks and essentially are equal in ranking to
the midsized banks. (We still are not satis-
fied, however, and want to be even better.)
We believe that our customer satisfaction
has been going up for multiple reasons: error
rate reduction, better products and services,
good old-fashioned service with a smile, and,
importantly, innovations like deposit-friendly
ATMs and continual improvement in online
and mobile banking services. While the chart
shows satisfaction in the Consumer Bank, we
also have had increasing customer satisfac-
tion scores in our small business, mortgage,
auto finance and credit card franchises.
Leading Client Franchises
Building exceptional client franchises
We have built our client franchises over time with substantial share gains and opportunity for more
2006 2014
Consumer &
Community
Banking
Deposits market share
# of top 50 Chase markets where we are #1
(top 3) deposits
Card sales market share
Merchant processing volume
3.6%1
11 (25)
16%2
#33
7.5%
15 (40)
21%2
#14
Relationships with ~50% of U.S. households
#1 customer satisfaction among largest U.S. banks
for the third consecutive year14
#1 primary banking relationship share in Chase footprint15
#1 U.S. credit card issuer based on loans outstanding2
~50% of U.S. e-Commerce volume16
Corporate &
Investment
Bank
Global Investment Banking fees5
Market share5
Total Markets6,7
Market share6,7
FICC6,7
Market share6,7
Equities6,7
Market share6,7
#2
8.6%
#8
7.9%
#7
9.1%
#8
6.0%
#1
8.1%
#1
16.2%
#1
18.6%
#3
11.5%
>80% of Fortune 500 companies do business with us
Top 3 in 15 product categories out of 1617
#1 in both U.S. and EMEA Investment Banking fees18
#1 in Global debt, equity and equity-related18
#1 in Global long-term debt and Loan syndications18
Top 3 Custodian globally with AUC of $20.5 trillion
#1 USD clearinghouse with 19.2% share in 201419
Commercial
Banking
# of states with Middle Market banking presence
# of states with top 3 Middle Market banking
market share8
Multifamily lending9
Gross Investment Banking revenue ($ in billions)
% of North America Investment Banking fees
22
6
#28
$0.7
16%
30
10
#1
$2.0
35%
Average loans grew by 13% CAGR 2006-201420
Industry-leading credit performance TTC — 8 consecutive
quarters of net recoveries or single-digit NCO rate
Leveraging the firm’s platform — average ~9 products/client
Asset
Management
Global active long-term open-end mutual fund
AUM flows10
AUM market share10
Overall Global Private Bank (Euromoney)
Client assets market share11
U.S. Hedge Fund Manager (Absolute Return)12
AUM market share12
#2
1.8%
#5
~1%
#1113
1.4%
#1
2.5%
#1
~2%
#2
3.4%
84% of 10-year long-term mutual fund AUM in top 2
quartiles21
23 consecutive quarters of positive long-term AUM flows
Revenue growth >70% and long-term AUM growth >80%
since 2006
Doubled Global Wealth Management client assets
(2x industry rate) since 200622
For footnoted information, refer to slides 11 and 50 in the 2015 Firm Overview Investor Day presentation, which is available on JPMorgan Chase & Co.’s website at
(http://investor.shareholder.com/jpmorganchase/presentations.cfm), under the heading Investor Relations, Investor Presentations, JPMorgan Chase 2015 Investor Day,
Firm Overview, and on Form 8-K as furnished to the SEC on February 24, 2015, which is available on the SEC’s website (www.sec.gov). Further, for footnote 20,
CAGR represents compound annual growth rate


